A new British research team has
concluded concluded that
Mass gains from accumulating snow, particularly on the Antarctic Peninsula and within East Antarctica, exceed the ice dynamic mass loss from West Antarctica. The result exacerbates the difficulty of explaining twentieth century sea-level rise.This of course is very interesting to me, and we do have some data from some Australian stations out on the cold continent. So lets see analyse the data from there.
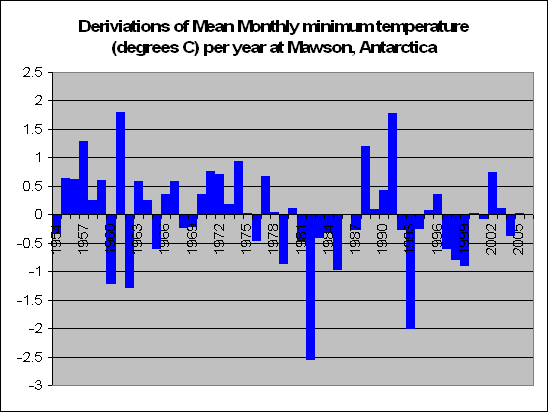
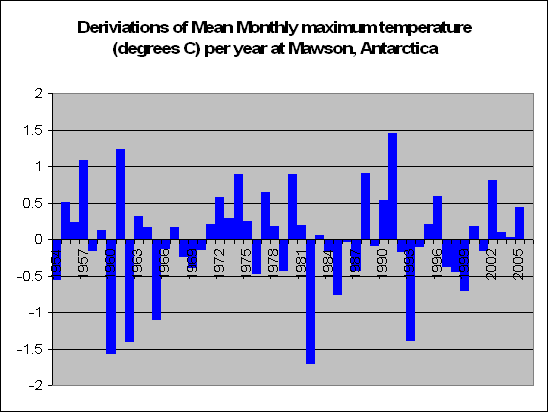
Mawson Mawson is a place named after Australian explorer Sir Douglas Mawson. Unfortunately they only have max and min data down there, and whilst I hate analysing data where the time isn?t kept constant, we shall give it a go anyway.

The graph above shows deviations from the average minimum temperature at Mawson from 1954. Tests prove no significant increase or decrease (F = 2.22, p = 0.14). And the graph below shows deviations from the average monthly maximum temperature, of which tests again show no significant increase or decrease (F = 0.07, p = 0.79).
 Macquarie Island
 is an island half way between Australia and the Antarctic. It is officially according to the ABM part of the great ice continent. So why not do some analysis on that. We have luckily this time, temperature data at certain times of the day, and instead of littering a post with 10 graphs I shall merely put links there for them.
And here they are. Temperature deviations from the average for the times of
midnight ,
3am ,
6am ,
9am ,
noon ,
3pm ,
6pm and
9pm .
Whist the data only goes from the 1960?s, we do see a pattern amongst the data. It seems that in the years 1963 to 1973 we had a less than average mean monthly temperature. From the years 1977 to 1989 the temperature was on average 0.3 degrees greater than average. And since then it has been up and down.
What is more interesting is the extreme similarity amongst the graphs. I had to even check twice to make sure that the data was correct and that they were actually not graphing the same information. They weren?t, and what this means is that the temperature deviations year to year at different times at Macquarie Island stay relatively constant. In that, in a certain year if we were to experience an increase in 0.5 degrees at 3pm, then there is a reasonable chance that we would experience a similar increase at 3am and 9pm and noon etc.
All test on the data proved that there was no significant increase or decrease in temperature (midnight F = 0.87, p = 0.355; 3am F = 0.63, p = 0.43; 6am F= 0.47, p = 0.5; 9am F = 1.46, p = 0.23; noon F = 1.72, p = 0.09; 3pm F = 3.32, p = 0.75; 6pm F = 2.44, p = 0.13; 9pm F = 0.97, p = 0.33)


