In his book The Wealth of Nations, Adam Smith argued that as individuals strive to maximize their advantage in life, they inadvertently contribute – as if under the influence of a “hidden hand”- to an aggregate disposition of wealth. Victor Yakovenko, a scientist at the Joint Quantum Institute, thinks that if Smith were a physicist, he might compare people (or nations) to molecules and replace the “hidden hand” with “thermodynamic process.” The new work appears in the Journal Entropy.
Yakovenko says the distribution of energies among molecules in a gas and the distribution of per-capita energy consumption among nations both obey an exponential law. That is, the likelihood of having a certain energy value is proportional to e^(-E/kT), where T is the temperature and k is a proportionality factor called Boltzmann’s constant. Temperature, in this case, is taken to be the average national per-capita energy consumption in the world.
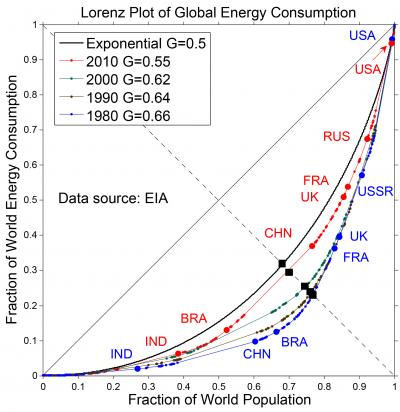
Studies of world energy consumption often feature plots of energy consumption or population over time. Yakovenko and his colleagues graphed the data in another way, using a Lorenz plot, where both the vertical and horizontal axes are dimensionless. The figure below shows data curves for four years – 1980, 1990, 2000, and 2010. The progression of curves is toward a fifth curve which stands for the idealized exponential behavior.

Statistically, both of these scenarios are rather unlikely. The bulk of possible divisions of $100 would look more like this example: person 1 gets $27, person 2 gets $15, and so forth down to person 10, who receives only $3. The black curve in the above figure represents this middle case, where, in the competition for scarce energy resources, neither total equality nor total inequality reigns.
“The labels along the curves are a stark reminder that some nations get much more than the average and some nations much less,” said Yakovenko. “The slope of the curve at any one point corresponds to the per-capita energy consumption. So the upper right of each curve is inhabited by the high-consuming nations: USA, Russia, France, UK. And the lower-left, lower-slope positions on the curve include Brazil and India. The movement of China upwards on the curve is the most dramatic change over the past 40 years.”
Yakovenko’s team calculated and graphed G over time, showing how G has dropped over the years. In other words, inequality in energy consumption among the nations has been falling. But the new study suggests that the trend toward lesser inequality in energy consumption will start stalling out, as the energy consumption distribution begins to approach full exponential behavior.
Is this because of the applicability of the laws of thermodynamics to national energy consumption? Are some nations destined to be rich and others poor? “Maybe not,” says Yakovenko, who believes renewable sources of energy could be a wild card. “These graphs apply to a well-mixed, globalized world, where a finite pool of fossil fuels is redistributable on a global scale. If the world switches to locally-produced and locally-consumed renewable energy and stops reshuffling the deck of cards [fossil fuels], then… inequality can be lowered further. After all, the Sun shines roughly equally on everybody.”
Related:
Discuss this article in our forum
Energy poverty linked to cognitive deficits
Error tolerance could slash computer energy use
Energy poverty killing more people than malaria
Physicists explore negative entropy in computation


Comments are closed.