Hey! That's just what I was saying about the graph; someone's taken a graph of the extinction coefficient in an absorbing medium and relabeled it to suite their agenda or "theory."
This all makes sense if you assume that after the IR is absorbed, it is "sequestered" and doesn't heat the atmosphere further. Based on that "theory," one could assume a graph of the extinction coefficient was proportional to the "warming effect."
It makes sense, but it's not true; not based on physical reality.
===
John,
About your link to another explanation of the logarithmic effect... see:
http://www.scienceagogo.com/forum/ubbthreads.php?ubb=showflat&Number=26614#Post26614Meanwhile, back on topic....Concentration affects how easily heat (a quantum of IR) traverses an absorbing (concentrated or dilute) medium.
As I think you've said, it slows the escape of the heat; a higher concentration increasingly retards the IR heat flow.
I suspect the term "extinction coefficient" has been taken to mean the point where all of the IR is "soaked up."
A better description would be the difficulty (or ease) of transmittance of an IR quantum; how much of the absorbing medium does the quantum need to travel through, before it's likely to be absorbed.
I've heard several numbers, between 10 and 100 meters, for the "total" absorption of IR by CO2. Whatever....
Raising the concentration, lowers the distance within which that IR is absorbed.
That's why they use the "extinction coefficient" to measure concentration.
CO2 that has absorbed IR, then becomes invisible to more IR, so any additional IR is absorbed by CO2 farther away, until it also becomes saturated (heated) by (and then invisible to) the additional IR. Even more IR would be absorbed by CO2 even farther away (through the hot, transparent CO2); and this would continue happening up through the atmosphere until, as the concentration of CO2 became too low, it would radiate away into space.
Now this is a good graph (except the "98% of heat" should include the 4.3micron CO2 peak also)! The second graph is especially instructive.
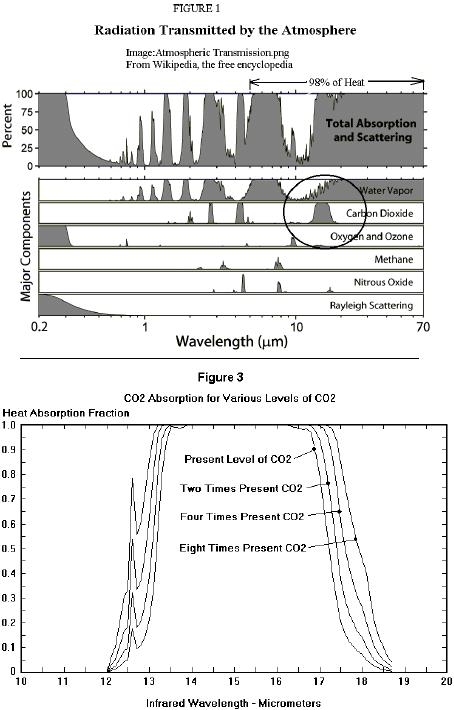
The area under the curve is the heat not escaping into space.
Lowering the CO2 concentration would lower the peak until some IR heat escaped into space at that wavelength.
As the graph shows, raising the concentration pushes the peak (at that wavelength) up, truncating the top, leaving a wider and wider plateau of absorbed heat not escaping into space. As you'll notice, the side notch (at ~12.6 microns) that absorb only ~20% of the heat currently, absorbs ~80% of the heat at 8 times present levels.
Notice the truncated plateau. Currently there is a window at ~13.75 microns, that will be closed by increasing levels of CO2.
Now we see from the graph that none of this heat escapes; so why doesn't all the CO2 become invisible as it becomes saturated with IR heat?
There is a relaxation time, or a decay rate, measuring how quickly (or slowly) CO2 loses that absorbed quantum.
Once it re-emits the absorbed IR, or loses heat through collisions, it is no longer invisible to additional IR, and so can absorb once again. Increasing the concentration, increases the re-absorption of previously re-emitted IR heat quanta, in addition to increasing the transfer of heat through an increased number of collisions.
This is a linear relationship; doubling the concentration, doubles the heat lost through collisions.
Of the IR heat that is 100% absorbed by the atmosphere (not transmitted into space), it is continually re-emitted and re-absorbed on a fairly local level (as proven by the extinction coefficient); until it is lost, translated into heat via collision with another molecule, allowing subsequent IR heat to be absorbed by the relaxed CO2. If this didn't happen, then some IR heat at that wavelength would escape into space.
The logarithmic extinction coefficient, relating absorbance to concentration (in a given distance), has nothing to do with the heating that is linearly related to concentration.
There's still the IR sources, collisions, and the changes in frequency that could be discussed; but I wanted to "debunk" that logarithmic graph (and related conclusions) as a good opportunity to examine some of the physics of atmospheric gases.
It seems to me that Archibald has taken the extinction coefficient (which approaches low levels within a few centimeters) and extrapolated out to 10 or so meters where the level would be essentially zero; and then he assumed extinction meant no further heating, and thus deduced that further increases in concentration would not appreciably increase the temperature.
Archibald indicates there is no basis for his graph when he says "Confirming the logarithmic effect of carbon dioxide is possible using the MODTRAN facility hosted by the University of Chicago."
This could be an example of "new physics" worthy of an "IgNobel Prize" in physics.
http://improbable.com/ig/ig-pastwinners.htmlY'know, I bet if it's true for CO2, it'd be true for all gases!
I can understand why I easily googled this quote, "David Archibald is perhaps the most discredited voice in the world of climate science." His logarithmic graph is "a tissue of statistical sophistry."
...quotes cited on
http://www.scienceagogo.com/forum/ubbthreads.php?ubb=showflat&Number=26535#Post26535Archibald seems to have duped the blog, climateaudit,
run by Steve McIntyre, the Canadian statistician, with his falsified graph.
They should get a physical chemist on their team to vet some of this stuff.
John, is it this "logarithmic effect of carbon dioxide" that makes you think CO2 isn't an increasing problem for our climate?
Thanks,
~samwik


