
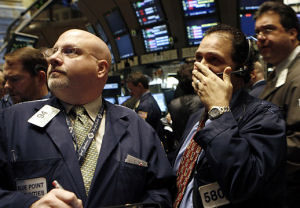
A new mathematical model developed by researchers from the University of Iowa challenges the generally held belief that stock prices cannot be predicted. The authors of the new study, published in the journalPhysica A, say that that there is a window of predictability once a stock price escapes the confines of the bid-ask spread.
“Price movements can be predicted with a better than 50-50 accuracy for anywhere up to one minute after the stock leaves the confines of its bid-ask spread,” said researcher Nick Street. “Probabilities continue to be significant until about five minutes after it leaves the spread. By 30 minutes, the predictability window has closed.”
The study examined price movements of a single stock – the S&P 500 exchange traded stock fund (SPY) – during 2005. The stock holds all 500 Standard and Poor’s stocks and is generally considered to be representative of the overall U.S. market. Perhaps most importantly, it also provides a rich data set, as it’s one of the most heavily traded equities, with an average of more than 90,000 transactions a day. The study tracked the stock’s price at 1, 3, 5, 10, and 20 seconds, and 1, 5, and 30 minutes.
Street’s analysis found no predictability of the stock’s price within the bid-ask spread (the space between the price that buyers are willing to pay for a stock (the bid) and the price sellers are willing to sell it for (the ask)) as the market attempts to set the value of an asset. But, Street said, the key is what happens once the price escaped that spread.
Street and co-researcher Michael Rechenthin found the stock price typically broke the spread after five to ten seconds, and the predictability of its subsequent movements depended on the pattern of its most recent trades. For instance, if the stock’s two most recent trades were an uptick followed by a downtick, there was a 52 percent probability the trend reversed itself within five seconds. Within 20 seconds, it had a 43 percent probability of reversal.
Rechenthin says these trends are driven only by previous trade prices because other factors that drive price – such as news or financial statements – cannot influence a price in such a short window.
While a 52 percent probability may not seem like much better than 50-50, Street points out that in the ocean of data that is stock trading, it is a notable increase, and something that can be exploited. The next step, he said, is to develop a working model that takes advantage of these probabilities for more efficient trading.
“This study is the first step in showing that there is predictability, and that once a price escapes the confines of the bid-ask spread, it’s showing a trend,” said Rechenthin. “In other words, it’s more than just a coin flip where the price goes.”
Related:
Discuss this article in our forum
Boffins take aim at finance bubbles
Capitalism on the couch: psychoanalyzing the credit crisis
Banking regulations could create financial chaos, say physicists
High testosterone drives risky investments
Source: University of Iowa
Related posts:
 Centimeter-accurate GPS system could radically transform mobile devices
 Prototype video camera requires no power
 Mis-synced music proves to be a powerful enhancement for TV ads
 3D images generated from single lens
 Conjoined rat brains demonstrate thought transference over the Internet
 New imaging device is flexible, flat, transparent, and disposable


Comments are closed.