Sam
the below temperature change graph clearly shows that we
are currently in the below 0.0 mark I pointed out.

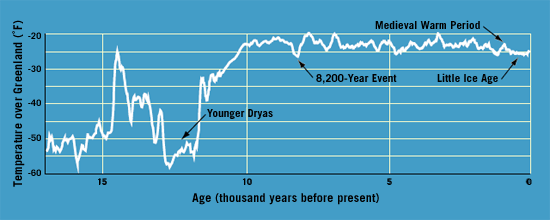
I like your two images above also.
and I really like the way these images explain that more
cooling is taking place vs warming.
even these two images show a distinct cooling over the
last (+/-) 10,000 yr period , no one could even suggest
that human interaction has caused any warming using these
images , however by using these images they would have a
good argument that humans may have caused an unusual degree
of climate stability along with a steady increase in cooling.
but , I highly doubt that the amount of interaction that
humans have contributed to the climate has had any truly significant effect on the climate.
the earth itself is highly capable and really very stubborn about cooling itself down all by itself as is evident in all
the ice core data.
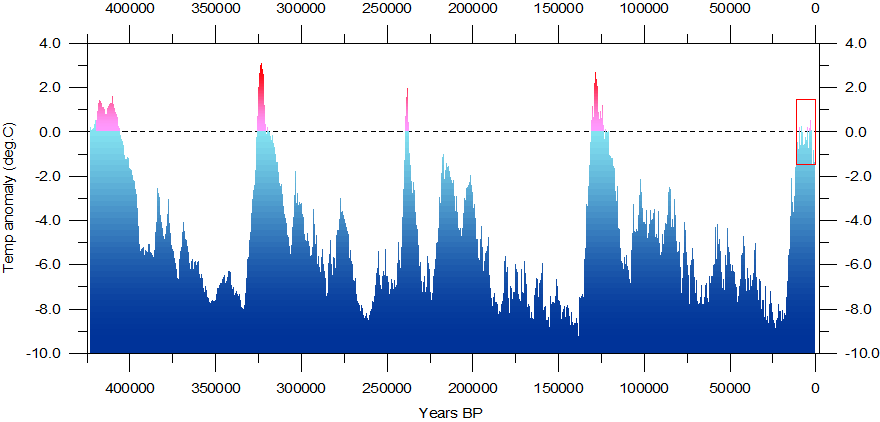
zoom this page in to 400%.
we are currently at the -1.3 mark on the above graph.
now draw an imaginary line from your right to your left of the
-1.3 mark until you reach apx 120,000 years ago.
you can get a idea of what our future temperatures
will be as the coming ice age approaches.


