Please keep your postings on-topic or they will be moved to a galaxy far, far away.
Your use of this forum indicates your agreement to our terms of use. So that we remain spam-free, please note that all posts by new users are moderated.
have you considered that the new waves are causing the sea ice to break up in the summer time?
I mean until recently the sea ice hasn't been breaking up during the summer time , so would it be reasonable to think that millions of pounds of water pushing up from underneath and washing up over the top of an ice sheet (depending on the height of the ice sheet of course) could have some tiny amount of force that could possibly break up the ice sheet?
once broken up by the waves the chunks of ice would be surrounded by warmer water that does not reflect the heat from the sun which melts the ice.
it cant be warmer temperatures because the temperatures aren't increasing according to the increasing amount of snow and ice accumulating on the artic and surrounding land.
we also are experiencing the effects of storms further south of the artic , and plenty of them.
3/4 inch of dust build up on the moon in 4.527 billion years,LOL and QM is fantasy science.
it took a while to find an image to put up that didn't look skewered to fit into a cause or a groups agenda.
here is a graph that shows the lag time before CO2 levels follow the temperature levels. this clearly shows that CO2 does not cause temperature changes , unless CO2 levels transport themselves into the future somehow.
we would need to check this using QM math to find out if this has already been claimed as a quantum effect.
since it took such a long time to find a image to use I decided that I needed to copy the image to my hard drive.
after all it is from a government web site ( EPA ) and if anyone would want to skewer data in order to gain income from CO2 taxes it would be the government.
so , I copied it just in case they decide to take it down or skewer it to fit into any tax purposes.
I actually like the EPA !!! but as in all govt agencies , they too have outside influences.
3/4 inch of dust build up on the moon in 4.527 billion years,LOL and QM is fantasy science.
like I said a few years back CO2 levels follow Temperature levels , this video shows that the CO2 following occurs apx 800 yrs after temperature !!
it took a while to find an image to put up that didn't look skewered to fit into a cause or a groups agenda.
here is a graph that shows the lag time before CO2 levels follow the temperature levels. this clearly shows that CO2 does not cause temperature changes, unless CO2 levels transport themselves into the future somehow.
...or perhaps the CO2 feedbacks "transport themselves into the" different hemispheres of the planet ...at different rates. ===
Gosh Paul, if you had a question about the Temp/CO2 lag, you should just ask; there is a lot of evidence (and better resolution graphs) out there. The 'lag' is also one of the points we covered in this EdX class on climate change, which MIT is now offering online, that I took last semester (see certificate at: https://s3.amazonaws.com/verify.edx.org/downloads/950c5511765d4c3fb39f5ecf5cf7e4b2/Certificate.pdf).
Total enrollment: 14,395 / Final enrollment: 10,789
Certificates awarded: 452
…it is a good idea to learn the mainstream science, if you want to proudly debunk it. ===
Quoting from the instructor....
Quote:
who is the Cecil and Ida Green Professor of Atmospheric Science in the Department of Earth, Atmospheric and Planetary Sciences at MIT. He obtained his PhD from MIT in 1978, and returned as faculty in 1981. His research investigates fundamental aspects of the fluid dynamics of the atmosphere, in particular tropical cyclones (a.k.a. Hurricanes or Typhoons) and tropical circulations in general.
In paleoclimatology, and just from thinking about the continent/ocean distributions, there is plenty of evidence to explain why the Northern and Southern Hemispheres don’t always act, or respond, in the same way. But it is good you’ve also got solid evidence from those EPA postings. So to recap, the mainstream scientific view is that:
“Antarctic temperatures varied in sync with CO2, and global temperatures …lagged a little bit behind the rise in CO2.”
~
Pyrolysis creates reduced carbon! ...Time for the next step in our evolutionary symbiosis with fire.
Paul, that information validated what you'd been saying about the lag pattern, so I'm not sure what you're objecting to; but whatever....
Originally Posted By: paul
LOL. Your graph doesn't show the famous spike in CO2 there sam.
in fact at 10 kyrs it shows a decrease in CO2 and a corresponding increase in temperatures!
care to explain that one?
...I'm not familiar with your "famous spike in CO2" reference either, for that time period; so sorry. ===
But as to the 10,000 yr mark, where CO2 begins declining --as expected geologically-- you're right; something else (such as deforestation, methane, and/or NO2) seems to have entered the picture and started offsetting the expected decline in temperatures ...especially after the dawn of the Bronze Age.
...plus, these little graphs add on the most recent few thousand years of GHG levels, for those greenhouse gases, which were not shown in the 'lag' graph that you replied about.
~
Pyrolysis creates reduced carbon! ...Time for the next step in our evolutionary symbiosis with fire.
...I'm not familiar with your "famous spike in CO2" reference either, for that time period; so sorry.
its the same spike as in the image you posted below , it just happens to be in a much smaller scale.
pictures are nice to have when you need to make a specific point , but lets consider real world events that would cause CO2 to increase...
temperatures rise.
the number of plants rise because of the warmer temperatures. the number of animals in the oceans rise because of the warmer water.
the number of animals in the ocean and on the land rises because theres more plants as food and theres more sea food for sea animals.
animals exhale CO2.
warmer = more life = more CO2.
can this work in reverse?
as in...
more CO2 = more life = warmer
you must have a reason for more CO2 what is it?
the levels of CO2 rises because of _________.
120,000 years ago , as is depicted in the above graph. temperatures were highest , there was then a lag time before CO2 levels reached their highest for that period.
if temperatures follow CO2 then why does this graph tell the exact opposite story?
in the graph at apx 30,000 years ago the ice age was at its peak , the temperature difference was -18F , at this point the earth was fully engulfed in an ice age and sea levels had dropped significantly , what do you think could have caused the increase in CO2 levels that you claim are followed by temperature increases?
Im really curious to understand why you think this way.
3/4 inch of dust build up on the moon in 4.527 billion years,LOL and QM is fantasy science.
…it is a good idea to learn the mainstream science, if you want to proudly debunk it.
I think that I would then have an investment that I might need to protect.
but Im glad that you earned your certificate in global warming physics.
I am wondering if your instructor avoided any type of discussion that would have been focused on the overall physics of global warming of the entire recorded history of the climate or did he focus mainly on the last few thousand years?
and , did he ever mention volcanic action as being a cause of greenhouse gasses?
or was he mainly concerned with human intervention as being a cause of CO2.
because , I have checked the image you posted below against several long running volcanoes and calderas and I find the years seem to match the CO2 increases in the image below for the Vesuvius eruptions but your graph seems to stop at the 6000 year mark , why does the graph stop at the 6000 year mark?
is this an example of cherry picking data to fill a basket full of cherries to give to the public?
It was then built up by a series of lava flows, with some smaller explosive eruptions interspersed between them. However, the style of eruption changed around 19,000 years ago to a sequence of large explosive plinian eruptions, of which the 79 AD one was the most recent.
I was going to compare santorini to the graph but the graph stopped before I had the chance!
3/4 inch of dust build up on the moon in 4.527 billion years,LOL and QM is fantasy science.
...I'm not familiar with your "famous spike in CO2" reference either, for that time period; so sorry.
its the same spike as in the image you posted below , it just happens to be in a much smaller scale.
Oh! That spike (today's famous hockey stick 'blade')! No wonder I didn't recall any famous spike from "that time period" covered in the graph you were asking about. So, glad you figured that out ...and can see it hasn't disappeared. ===
Originally Posted By: paul
pictures are nice to have when you need to make a specific point , but lets consider real world events that would cause CO2 to increase...
temperatures rise. the number of plants rise because of the warmer temperatures. the number of animals in the oceans rise because of the warmer water.
the number of animals in the ocean and on the land rises because theres more plants as food and theres more sea food for sea animals.
animals exhale CO2.
warmer = more life = more CO2.
can this work in reverse?
as in...
more CO2 = more life = warmer
you must have a reason for more CO2 what is it?
the levels of CO2 rises because of _________.
This overly simplified picture should make you wonder.
...By that reasoning I wonder also ...if "the number of plants rise because of the warmer temperatures," then why doesn't that offset the rise, as more "animals exhale CO2." ===
Originally Posted By: paul
120,000 years ago, as is depicted in the above graph. temperatures were highest, there was then a lag time before CO2 levels reached their highest for that period.
if temperatures follow CO2 then why does this graph tell the exact opposite story?
in the graph at apx 30,000 years ago the ice age was at its peak , the temperature difference was -18F , at this point the earth was fully engulfed in an ice age and sea levels had dropped significantly , what do you think could have caused the increase in CO2 levels that you claim are followed by temperature increases?
Im really curious to understand why you think this way.
What are you, deaf or blind or just feigning ignorance? You are looking at graphs, which are comparing Antarctic readings and global readings ...but “Antarctic temperatures varied in sync with CO2, and [while] global temperatures lagged a little bit behind the rise in CO2.” –Prof. Dr. Kerry Emanuel, 2014. ===
Paul, historically "...the levels of CO2 rises because of _________" ...Milankovitch (orbital) 'forcing' cycles ...and associated feedback forcings.
Paul, the planet's albedo (snow/ice cover) has historically been especially sensitive to the July insolation at 65° N. Latitude.
So if the planet tilts just right, in some cycle, then (historically, over the past few million years), 'forcing' of the climate has ensued.
~
Pyrolysis creates reduced carbon! ...Time for the next step in our evolutionary symbiosis with fire.
You are looking at graphs, which are comparing Antarctic readings and global readings
do you have a graph available that shows what you want a graph to show , other than the graph that you showed earlier that only has a 16 thousand year span that reflects your temperature following CO2 proposition?
I can probably guarantee you that if there is a period where Temperature increases actually follow CO2 increases it will most likely be due to CO2 released by volcanic action.
BTW , please try to get a graph that will start today and go back in time at least 100,000 years.
maybe you can find one that will show both the arctic and Antarctic CO2 levels along with global temperatures.
good luck.
3/4 inch of dust build up on the moon in 4.527 billion years,LOL and QM is fantasy science.
…it is a good idea to learn the mainstream science, if you want to proudly debunk it.
I think that I [A big conspiracy] would then have an investment that I might need to protect.
but Im glad that you earned your certificate in global warming physics.
I am wondering if your instructor avoided any type of discussion that would have been focused on the overall physics of global warming of the entire recorded history of the climate or did he focus mainly on the last few thousand years?
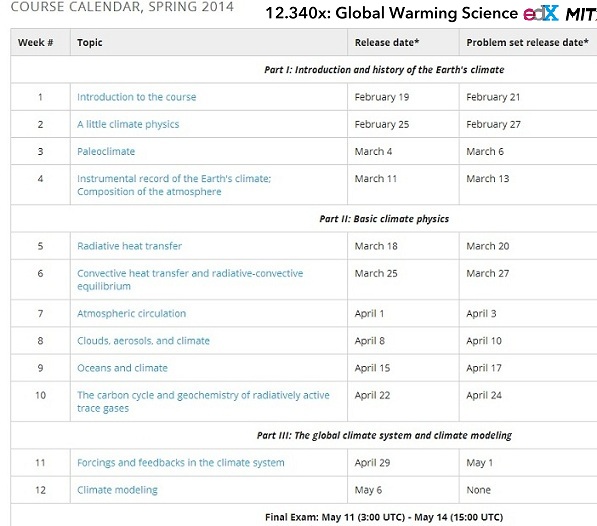
...The class covered the whole 4.5 billion years of biogeochemical evolution for the planet, and the physics for heat distribution and balance, all of which is what generates the climate. But I can see how, since they didn’t call the class “Climate Science,” you could think the focus was only on global warming. I think the title was designed to attract the most interest.
But here is what their syllabus looked like: …click to enlarge, or there is a text version, if that’s still too unreadable.
I think they were perhaps “screening” for some likely ‘best prospects’ to help them wrangle, and improve, their current climate models; since most of the homework was geared toward deriving or “proving” or demonstrating how models work for each topic, by using standard physics and thermodynamics, and calculus ...or what they called “ordinary differential equations” ...which the syllabus said we'd only need occasionally (yea, on part of almost every section)!
Originally Posted By: paul
and , did he ever mention volcanic action as being a cause of greenhouse gases?
Of course, Paul, volcanoes are one of the major climate forcers; and with multiple effects.
Originally Posted By: paul
or was he mainly concerned with human intervention as being a cause of CO2.
He is “mainly concerned” with reality …and learning how to better model our circumstances.
Originally Posted By: paul
because , I have checked the image you posted below against several long running volcanoes and calderas and I find the years seem to match the CO2 increases in the image below for the Vesuvius eruptions but your graph seems to stop at the 6000 year mark,
why does the graph stop at the 6000 year mark?
is this an example of cherry picking data to fill a basket full of cherries to give to the public?
.... I was going to compare Santorini to the graph but the graph stopped before I had the chance!
...you ask "why does the graph stop at the 6000 year mark?"
Paul, you are seeing conspiracies where none exist. The picture isn’t from the class, though they did use it in one lecture. The picture is from some other scientific source (Shakun et al., 2012 iirc). That is the way science works; it builds on the provisionally vetted work of others.
Too bad they didn’t know what you thought was important.
...but as they state in their [free] abstract:
“Here we construct a record of …the last (that is, the most recent) deglaciation.”
Their focus is on then (and the few thousand years on either side of 'then'), rather than now. Does that make sense to you, or do you still see it as cherry picking the data? ===
It was then built up by a series of lava flows, with some smaller explosive eruptions interspersed between them. However, the style of eruption changed around 19,000 years ago to a sequence of large explosive plinian eruptions, of which the 79 AD one was the most recent.
....
...very interesting!
There are plenty of very high-resolution records for the period you are wondering about, if you want to focus on that period and look for patterns. But that wasn’t the purpose of Shakun’s paper.
Maybe this Vesuvius record will help you see a pattern for the period you are interested in: Gosh, it looks as if maybe the ice-age part of the cycle keeps the volcano quiet, but that the volcano gets more/differently active when a 'warmed up' climate also warms up the oceans and the crust of the planet ...but when it is more likely topped with ice, it is quieter, more effusive, and/or the lateral vents are preferentially active. ===
But seriously now folks... Paul, do you know about Milankovitch “forcing” ...of the climate, and those Milankovitch (or orbital) cycles?
Do you know how the orbital forcing compares, and contrasts, with greenhouse gas forcing?
Originally Posted By: fyi
Orbital forcing doesn’t change the average incoming energy, but it does change the distribution of that average incoming energy. GHG forcing does change the overall balance of that average incoming energy.
...or about why different hemispheres respond to change differently, or why the different oceans have different salinities and different temperatures?
~
Pyrolysis creates reduced carbon! ...Time for the next step in our evolutionary symbiosis with fire.
or do you still see it as cherry picking the data?
sam , when you posted the image below , I had just posted that CO2 increases lag behind Temperature increases by apx 800 years and my image spanned 800,000 years.
your image had a span of only 16,000 years and was an obvious attempt to support your proposal that Temperatures lagged behind CO2 increases , thus my claim that cherry picking data was in play.
I may have misunderstood your post , you may have simply been showing that volcanic activity can cause CO2 levels to lead Temperature levels.
even so , what it all boils down to is that temperatures are not increasing , temperatures are decreasing even though mans contribution of CO2 through the use of fuels is 1000 times the amount of global CO2 produced by volcanic activity per year.
CO2 is not causing warming it is causing cooling...
if you need a reason to reduce the CO2 emissions then you should focus on the obvious ability of CO2 to cause the earth to cool.
I would say that focusing on increasing methane to warm the planet would be the choice.
and of course a balance of methane when the right temperature has been achieved.
but I don't really think that we can get ourselves out of this backwards way of thinking that we have gotten ourselves into quick enough to actually accomplish a balance.
think about how the world is using methane as a energy source today...
landfills now burn the methane to make energy.
3rd world nations homes have methane digesters to make methane as a fuel.
fires destroy much of the natural methane.
man really is changing the climate , we just have the wrong information.
3/4 inch of dust build up on the moon in 4.527 billion years,LOL and QM is fantasy science.
here is a follow up on the july cold weather in the U.S. from the weather channel.
Quote:
Temperature records set way back in the 1880s were broken as unusually cool air blanketed a large part of the country in the heart of summer. It felt more like fall from the Upper Midwest into the South this past week.
An unusually strong cold front for July began its southward plunge on Monday, July 14. The result was below-average temperatures for much of the central and eastern U.S.
(MORE: Coldest July Days Ever Recorded in America)
All-Time Record Low July Temperatures
Many all-time record low temperature records for the month of July were broken. On Wednesday morning Joplin, Missouri tied its all-time July record low of 50 degrees.
The state of Oklahoma recorded its coolest July day on Thursday with an average temperature of 63.6 degrees. The previous record was 66.3 degrees set on July 12, 1953. The average temperature is found by adding up all the high and low temperatures across the state, then dividing the total by two and then dividing by the number of reporting stations.
On Friday, all-time record coolest high temperatures for the month of July were set across much of the South. A few of the cities that set records are Memphis, Tennessee; Greenwood, Mississippi; and Longview, Texas.
Based on the analysis of entrapped air from ice cores extracted from permanent glaciers from various regions around the globe, it has been demonstrated that global warming began 18,000 years ago,
--->the many eruptions of Vesuvius !!!<---
accompanied by a steady rise in atmospheric carbon dioxide. Humans are quite likely the cause of a large portion of the 80 ppm rise in CO2 since the dawn of the Industrial Revolution, and from a distance, it looks possible that increasing CO2 may cause atmospheric temperatures rise. However, on closer examination it is seen that CO2 lags an average of about 800 years behind the temperature changes-- confirming that CO2 is not the primary driver of the temperature changes.
The real signature of greenhouse warming is not surface temperature but temperature in the middle of the troposphere, about 5 kilometers up. If global warming is occurring from an increasing greenhouse effect due to CO2 additions by humans the temperature of the middle troposphere should be warming faster than Earth's surface (1,2). However, the opposite has been happening--- which suggests either the surface temperature records are in error or natural factors, such as changes in solar activity, may be responsible for the slight rise in surface temperatures (approximately 0.6° C, globally) that appears to have occurred over the past century.
Interestingly, from 1999 to the present the temperature of the mid troposphere has actually decreased slightly and surface temperatures have ceased warming -- even as CO2 concentrations have continued to increase (3). This should not be happening if CO2 increases to the atmosphere are the primary driver of global warming
I have noticed as you may also have noticed in the above graph at apx 147,000 years ago also that is as far back as the CO2 data on the graph goes there was an event that caused CO2 levels to lead Temperature levels , this is most likely due to volcanic action.
ok , I found it I think , it was a caldera , the Cos Caldera
Quote:
The Nisyros volcano is the most active remain of the Cos caldera that exploded aprox. 150.000 years ago.
here is a website that talks about the 800 year lag time from temperature increase to CO2 increase. http://www.geocrap....
...Sorry Paul, that is (I feel certain) a well-known AGW denialist website.
I first ran across that site (iirc) back in '08 or '09, while searching for graphs that showed the evolutionary and climate history of the planet. They have neat pictures and graphics, which are usually valid and unmodified, and from valid scientific sources.
But their "conclusions" are editorialized claptrap opinions. Don't get trapped! Look, but don't leap!
So even when they use valid scientific data/graphs, they only post their own (denialistically) 'logical' contusions; instead of posting the freely available conclusions, which experts have written specifically to accompany the original data/graphs. So I hope they are ‘well known’ for being a slick, junk-science website ...albiet with useful pictures and graphs!
Your cited site is an extensive site (covering any search on paleoclimate that somebody might try). But they manipulate valid data to "show" how any problem with the climate (which people might search online for information about]) can be viewed as normal and not a sign of any problem.
If anyone knows differently, or my memory is faulty regarding that website's content, please update this WARNING!
~
Pyrolysis creates reduced carbon! ...Time for the next step in our evolutionary symbiosis with fire.
the images they have are valid , but the reasons they give to compliment the images are not scientifically accepted.
personally , I can easily argue with that line of thought.
simply because CO2 levels follow Temperature levels. except when volcanic action is in play.
and for some reason the scientifically accepted reasons never seem to bother explaining why the global ice core data and the images produced from that data clearly show that CO2 follows Temperatures.
but the GW scientist or whatever they think they are expect us to blindly believe that the exact opposite is true.
with this data / evidence in hand it seems more truthful to say that those who believe that CO2 causes warming are the true deniers of the truth.
Quote:
which experts have written specifically to accompany the original data/graphs.
expert at what?
from what I understand the IPCC uses only a tiny fraction of the available experts possibly / reportedly because the remaining majority of experts do not think along the lines that could sustain the existence of the IPCC and its goals or its agenda.
3/4 inch of dust build up on the moon in 4.527 billion years,LOL and QM is fantasy science.
Latvia recorded its highest-ever daytime temperature on Monday, with mercury in the usually nippy Baltic republic hitting 37.8 degrees Celsius (100.4 Farhenheit) in the western port city of Ventspils, state meteorologists confirmed.
The city also saw a record-breaking 36.9 degrees Celsius on Sunday, topping a previous high of 36.4 degrees set in the south-eastern city of Daugavpils [west, and 100 miles south of Ventspils] in 1943.
...at the same latitude as Kodiak Island, Alaska! ===
So it all averages out, in the end; nothing new to see here, right?
~
Pyrolysis creates reduced carbon! ...Time for the next step in our evolutionary symbiosis with fire.


 …
…

