Please keep your postings on-topic or they will be moved to a galaxy far, far away.
Your use of this forum indicates your agreement to our terms of use. So that we remain spam-free, please note that all posts by new users are moderated.
global warming enthusiast will be happy to know that the U.S. portion of global warming will be slightly delayed for a few years as the fluctuations of the coming ice age make itself known globally.
not to worry however , after a few years have passed global warming will begin to pick up its pace once again for an even shorter period than the last warming period that extended from the 1970's until recently which was also a fluctuation of the coming ice age.
------------------************************-------------------- notice: as far as I know of... the above statement has not been approved by the IPCC. ------------------************************--------------------
Quote:
Well buckle up, America. We’re getting another dose of polar air next week, and just in time for what is normally the hottest week of the year.
While next week’s mid-summer cold snap won’t send you rushing for the nearest space heater, its origins are similar to the cold snaps that defined the brutal winter just past.
Paul, your 2nd graph looks "altered," compared with the commonly available graphs of the same data, istm. Where did your copy come from? ===
But regardless (since it has no relevance to the OP), this increased variability (in weather) ...agrees with AGW predictions; especially as a consequence of the increased warming of polar regions. That extra warming lessens the temperature differential, so....
That weakens the Polar Jet Stream, which if it were strong enough, would normally keep the polar vortex more centered at the pole. Now, with a weaker Polar Jet Stream, the 'vortex' can wander more.
This also allows even more warm air to infiltrate into the (normally protected by the Jet Stream) polar regions. I'd bet that if you look at global weather, you'll find some unusually warm temps in the Arctic regions, concurrently with your (local) 'July cold snap.'
This video explains how that works, but it is in Celsius; so when they talk about "differences" or "increases" in degrees, you need to double (roughly) the changes ...to get Fahrenheit degrees change. Also: 100mm/hr = 3.94 inches/hr...
Quote:
"How is it that a slightly warmer atmosphere can create weather that swings from one extreme to the next?"
"From Lazy Jet Streams to Baking Soils, in this report we explain the mechanism behind some of the most catastrophic events of the decade."
"Understanding exactly how a warmer world drives weather wild is crucial to predicting just how bumpy a ride we are in for."
"So how is it that it can be getting hotter, drier, and wetter at the same time?"
...plus one more:
"And with the speed that emissions still enter the atmosphere, we're right on track for an unrecognizable future."
~
p.s. At minute 12:00 is where the 'Jet Stream' explanation starts (really 13:00-14:00), and it follows through between minutes 15 to 16 ...plus.
Pyrolysis creates reduced carbon! ...Time for the next step in our evolutionary symbiosis with fire.
It looks like extreme weather events are here to stay. In time we may even have a new American desert in the central US. The desert southwest is suffering a prolonged drought. The Midwest may move into a desert eventually. The Missouri river has already flooded near here once this year due to heavy rains in the northern tier of states that feed its tributaries. The amount of water exceeded the capacity of the dams on the Missouri to buffer the flow, so some local farmland got irrigated that wasn't supposed to be irrigated. I hope they had flood insurance. It's hard to see your friends and neighbors lose their livelihood at the mercy of Mother Nature. At least it is not as bad as the floods of 2011 that wiped out whole towns and endangered 2 nuclear power plants. I expect we'll learn to cope with it eventually.
If you don't care for reality, just wait a while; another will be along shortly. --A Rose
I really do think that this site should also have a side by side comparison of the Antarctic as well , that could be very revealing when global cooling is concerned as the ice age progresses.
as it stands you would need to visit the site each day and download the image for the day and build a comparison yourself.
and yes that has worked well.
Quote:
"And with the speed that emissions still enter the atmosphere, we're right on track for an unrecognizable future."
what we do to the atmosphere cannot stop or slow the coming ice age , we should not focus on what is causing the climate changes , we should focus on preparing for the coming ice age.
3/4 inch of dust build up on the moon in 4.527 billion years,LOL and QM is fantasy science.
Paul, your 1979 – 2014 comparison shows distinctly warmer conditions in 2014. True there is the patch you mention where there is more snow cover; but to use these pictures, even to imply a global decrease in temperature is below your usual standard of argument.
I tend to avoid “Global Warming” arguments, precisely because I suspect both sides of skewing the evidence.
When I first met the “Global Warming” arguments, my interest in geology made me think it was probably sensationalist hype. Looking at geological history, I saw a succession of glaciations and inter-glacial periods. I could see no reason to think that the present was anything other than an inter-glacial period, that we could expect temperature fluctuations and eventually another glaciation.
However, there are a few things we should keep in mind. Global Warming is a singularly unfortunate term. It tends to give the impression that what we are considering is a steady progression towards a warmer, possibly drier, climate everywhere, all at once. A better term is Global Climate Change, which allows for a patchwork of changing conditions which may, or may not, be heading towards generally warmer conditions in the future. To make any sort of decision on this last point requires a careful and unbiased look at all the evidence.
One of the things in dispute is whether or not human activity is influencing the weather. Consider the effect that stromatolites and subsequent oxygen producing organisms had on the atmosphere. The rise of oxygen levels brought about a major extinction of life on Earth. The effects of this change are still with us, but we are removing large quantities of the tree cover that helps to clear up CO2 and refresh O2; and we are pumping vast amounts of “greenhouse” gasses into the atmosphere. What makes us think that we are less efficient than stromatolites at altering the composition of the atmosphere?
I think that, to some extent, both sides are right. We are altering the atmosphere, we are moving towards an increasing “greenhouse effect”, it may have disastrous consequences in terms of sea level changes, and agricultural problems; but in terms of the geological perspective, who or what ever may not survive, the planet will.
“Save the Planet” means, in its broadest sense, save the current occupants – animal and vegetable, and in its narrowest sense, save the human race.
In the long run, Earth will survive and continue with its cycles of warm and cold, whatever we do. The important thing, in my view, is that we try to minimise the harm and suffering we cause while we are here.
Paul, your 1979 – 2014 comparison shows distinctly warmer conditions in 2014. True there is the patch you mention where there is more snow cover; but to use these pictures, even to imply a global decrease in temperature is below your usual standard of argument.
Im guessing that you didnt look at the January 1 1979 and January 1 2014 comparisons.
as the top link was to a set of images made from satellite data taken in the summer , there is a great amount of difference between the summer and the winter comparisons between the two years.
its obvious to me that you did not see the bottom link to the winter data.
to me even the july 1 1979 and july 1 2014 data shows a large amount of cooling as it shows a great increase in the snow cover area as in thousands possibly hundreds of thousands of square miles.
Forbes has a article about the hype you spoke of as profiteers of global warming knowingly propped up global warming as a means of gain.
Climate change itself is already in the process of definitively rebutting climate alarmists who think human use of fossil fuels is causing ultimately catastrophic global warming. That is because natural climate cycles have already turned from warming to cooling, global temperatures have already been declining for more than 10 years, and global temperatures will continue to decline for another two decades or more.
That is one of the most interesting conclusions to come out of the seventh International Climate Change Conference sponsored by the Heartland Institute, held last week in Chicago. I attended, and served as one of the speakers, talking about The Economic Implications of High Cost Energy.
3/4 inch of dust build up on the moon in 4.527 billion years,LOL and QM is fantasy science.
True, there is more extensive snow cover in 2014, but that proves nothing other than that there was heavy snow that year. Even here in UK we have isolated years in which we have a lot more snow than usual. Often, these do not co-inside with years of lowest temperatures.
Balance against the extra snow the fact that the areas of lowest temperature are smaller in 2014. Either side could find supportive evidence.
the fact that the areas of lowest temperature are smaller in 2014
could you post a link to that data?
it would be nice to have a whole picture to look at.
a picture that would reveal how the temperatures throughout the globe have fluctuated over a period of time.
the problem with the construction of that picture is that there are groups of people who have an incentive to lay out the picture the way that their group wants the picture to appear.
there is free data available but not for commercial use.
even though the acquisition of the data has already been paid for by the citizens of the U.S. the citizens can only access the data through the web site or a application that might have been compromised by a group of people that may have an incentive to sway the data in a manner that would further advance their cause.
if the data was freely available for use to programmers that build applications then this would give an incentive to programmers to develop an application that would not cherry pick the data to be displayed and it would remove the monopoly that the incentive driven groups have on the display of the data.
I haven't looked at the applications on the web site yet and you may not have access.
but I can tell you that I personally would not place any bets on the data that is used in the applications representing a true account of the overall climate.
as the incentives would cause the data to be cherry picked.
all that I can do is look at the thousands of record low temperatures in the summer time.
and all of the thousands of record low temperatures in the winter time.
and the satellite imagery that tells its own story from day to day.
let me give a few examples of global incentives.
#1 ... cap and trade.
#2 ... real estate.
#3 ... United Nations agenda
etc...etc...etc...
I just looked at a few of the web apps...
what a waste of taxpayer money , the apps they have are anything but useful unless you only want to try and use it for some purpose , just to try and use it for some purpose.
I guess that's the way they want it , because that's what they have.
that really makes me sick , not angry because I understand that its the government , but they have all of that data from all over the world , just think about all the instruments and all the labor and time involved to get the vast amount of data and then to have this as the final product... it really is the year 2014 isn't it , but from the looks of the web site and the usability of the web site it looks as if the apps were built using windows 3.1 and visual basic 2.0
its like having a bank vault that is continuously filling itself with money , but you don't have any way to get into the vault to spend any of the money.
Bill S , you wouldn't happen to have a whole picture I could look at would you?
3/4 inch of dust build up on the moon in 4.527 billion years,LOL and QM is fantasy science.
the problem with the construction of that picture is that there are groups of people who have an incentive to lay out the picture the way that their group wants the picture to appear.
Originally Posted By: Bill S
I tend to avoid “Global Warming” arguments, precisely because I suspect both sides of skewing the evidence.
Are we so far apart?
I still think we are in an interglacial period, but I don't see that as an absolute argument against human activity being able to influence climate in the relatively short term.
I'm told there are "fundamentalist" groups who argue that we cannot influence the climate, because it will always be what God wants it to be, but I'm a little reluctant to accept that reasoning in its entirety.
click on the above link , save the image to your hard drive , then open it with ms paint.
then zoom in on the red box to the right.
that is where we are right now on the graph , below the 0.0 mark !
Quote:
Are we so far apart?
I still think we are in an interglacial period, but I don't see that as an absolute argument against human activity being able to influence climate in the relatively short term.
I'm told there are "fundamentalist" groups who argue that we cannot influence the climate, because it will always be what God wants it to be, but I'm a little reluctant to accept that reasoning in its entirety.
we definitely are not far apart , were just looking at different scales of data.
I try to look at the evidence on a larger scale and that larger scale is what turned my opinion from GW and AGW into IA only with fluctuations of course.
we are in an ice age , and trying our best to maintain the warm weather , but its just not possible...
all the money that is being spent on talking about it will accomplish nothing except a lack of preparedness.
the governments are not lacking they are busy building the underground survival facilities all across the globe.
were not invited to attend , but were paying for them.
its time for us to start our own preparations.
I can easily say in reply to the part about God , that God gave us all a brain to think with , and its up to us to fill the brain with our choice of data.
we can no longer just assume that all data is correct and that is where the brains capability of logic comes into play.
I suspect that orac will see the above as an opportunity to impress us with his favorite rant about some goat god that he must believe exist.
3/4 inch of dust build up on the moon in 4.527 billion years,LOL and QM is fantasy science.
I still think we are in an interglacial period, but I don't see that as an absolute argument against human activity being able to influence climate in the relatively short term.
Bill, that is a huge site! Lots of graphs, but I didn't see this type (from a Greenland ice core) that gives more resolution. www.eoearth.org
These ice core graphs are showing the change or anomoly relative to the "present day" temperature, such as the -55.5 C (degrees below zero) that was recorded with Paul's Vostok graph. But it's all relative; so they all still indicate climate changes, more or less....
What I find most interesting, is the long and relatively flat period ...during which civilization arose. It seems relatively flat and level compared with almost any other similarly long period from either the 100kyr graph [with the much better resolution or magnification of Paul's 'box'] ...or the 400kyr graph with the exaggerated 'y-scale' and a 'zero' that is different from today (if I am to believe what I read here earlier). ===
History (of civilization) is a long story filled with tales of how climate changes have helped make or break various regional societies, istm.
But looking at these graphs, doesn't it seem that climate is usually much wilder than anything we have experienced over the past few thousand years or so? You can imagine how those peaks of Paul's (the previous interglacials) would look on the scale of this 100,000 year graph ...I hope!
It may have been briefly "warmer" during the past interglacials; but for how longor how 'evenly' was the climate as warm or warmer, during those previous interglacials ...compared with our current interglacial?
That which history experienced as the MWP & LIA seems to only register as a level slope on both of these graphs. Can you imagine civilization's story overlayed onto any other period, from either of these graphs? How lucky have we been?
I'd agree it is prudent not to 'force' our climate too far away fromthe 'level slope' that civilization (especially agriculture) has enjoyed ...or survived--or not ...since the beginning ~10,000 years ago--so to speak.
~
p.s. ...or at this scale also, the past ten thousand years are unusually calm, compared to how climate behaved before. www.soest.hawaii.edu/
Last edited by samwik; 07/18/1410:05 AM. Reason: add p.s,
Pyrolysis creates reduced carbon! ...Time for the next step in our evolutionary symbiosis with fire.
the below temperature change graph clearly shows that we are currently in the below 0.0 mark I pointed out.
I like your two images above also. and I really like the way these images explain that more cooling is taking place vs warming.
even these two images show a distinct cooling over the last (+/-) 10,000 yr period , no one could even suggest that human interaction has caused any warming using these images , however by using these images they would have a good argument that humans may have caused an unusual degree of climate stability along with a steady increase in cooling.
but , I highly doubt that the amount of interaction that humans have contributed to the climate has had any truly significant effect on the climate.
the earth itself is highly capable and really very stubborn about cooling itself down all by itself as is evident in all the ice core data.
zoom this page in to 400%. we are currently at the -1.3 mark on the above graph. now draw an imaginary line from your right to your left of the -1.3 mark until you reach apx 120,000 years ago.
you can get a idea of what our future temperatures will be as the coming ice age approaches.
3/4 inch of dust build up on the moon in 4.527 billion years,LOL and QM is fantasy science.
I highly doubt that the amount of interaction that humans have contributed to the climate has had any truly significant effect on the climate.
...why?
Search: ruddiman early anthropogenic hypothesis
You don't even need to select any of the search results, but just browse ...to get the idea. [such as: http://www.nature.com/news/2011/110325/full/news.2011.184.html ] "...new evidence in support of the controversial idea that humanity's influence on climate began not during the industrial revolution, but thousands of years ago. Proposed by palaeoclimatologist William Ruddiman in 2003, the theory says...."
Ruddiman was an early researcher, and is widely cited in old climatology research; but he's now moved beyond the mainstream IPCC dogma, and he sees a more comprehensive, big-picture, perspective ...imho.
http://www.evsc.virginia.edu/ruddiman-william-f/ His "...earliest research was on orbital-scale changes in North Atlantic sediments to reconstruct past sea-surface temperatures and to quantify the deposition of ice-rafted debris."
A few years ago I met with a local climate science professor to ask him about my ideas of soil, and soil's influence on climate. He told me about Ruddiman's ideas, which were along similar lines, and he suggested I read "Plows, Plagues and Petroleum: How Humans Took Control of Climate" by William Ruddiman.
Have you not heard of this? His book was "Winner of the 2006 Book Award in Science..." in case that makes any difference for you. Have you also not read 1491, by Mann ...or not read Vestal Fire, by Pyne? ===
As you noted, the planet is "highly capable and really very stubborn about cooling itself down all by itself...." But Humans have been fighting the planet's natural trends, for millennia, as Ruddiman, Mann, Pyne, and others show.
...of course recently we've gone a bit overboard, with that 'industrial age' phase, but we can still moderate things. ~
Pyrolysis creates reduced carbon! ...Time for the next step in our evolutionary symbiosis with fire.
Im not saying that humans have not added heat to the atmosphere because its clear that we have caused additional heat , when I said truly significant effect on the climate , I meant that what we have done has not been enough to maintain the warm climate because the climate is cooling.
and has been steadily cooling for over 10,000 years which is the apx scientifically recognized time when civilizations supposedly first appeared.
we cant avoid the ice age and its global cooling effects by reading books and simply saying that the climate is warming and making money off of the many profiteers schemes that are arising because of the not so well hidden hype of global warming due to human interaction.
true , you can make it appear that the climate is warming by only showing people the last few hundred years but as soon as you look at the natural pattern of global climate change that is made evident in the ice core data that stretches past several ice ages you realize that even with human interaction the climate is still cooling not warming.
3/4 inch of dust build up on the moon in 4.527 billion years,LOL and QM is fantasy science.
I meant that what we have done has not been enough to maintain the warm climate because the climate is cooling.
and has been steadily cooling for over 10,000 years which is the apx scientifically recognized time when civilizations supposedly first appeared.
Certainly the Milankovitch Cycle should have 'forced' a steady cooling, it would seem:
...note the "present" at zero, in the center. Presently, we are near a low point, following a large decline. ===
=>Here is an enlarged image of that most recent decline (at the far right) ...for orbital forcing (dotted line) ...and the temperatures (colored line):
Well, you might expect a cooling trend to have started some 8-10 thousand years ago, except for some reason temperatures switched with the forcing, with temps now registering above the orbital forcing line. ...hmmmmmm.
~
Pyrolysis creates reduced carbon! ...Time for the next step in our evolutionary symbiosis with fire.
yes , this image also shows that a steady cooling has been taking place in the last 10,000 years , and clearly shows the extent that many people will go to in order to circulate propaganda that we are in a warming period due to human interaction.
have a look at the orbital line between the years -180,000 and -140,000 the temperatures were way below the orbital forcing line , however there was a steady decrease in temperatures with fluctuations of course , and this continued to remain in effect even as the orbital forcing line dips to its lowest point at -160,000 years ago and then rebounds to its highest point around -148,000 years ago and continued further into -140,000 years ago.
which shows a 40,000 year period that is somewhat stable accompanied by a steady decrease in temperatures. could this 40,000 year period have been caused by an advanced civilization?
of course today any evidence of those civilizations would be located under the oceans , and we have explored our oceans to such a great extent that we already know that we know enough to claim that we know it all.
I would say that there is something else other that the orbit that causes temperature changes and according to this graph and the vastness of human knowledge it certainly is not human interaction.
of course if you look at the years between -100 and 0 you can see a slight upturn of temperatures. and we can of course claim that human interaction has caused this slight upturn , but that would also mean that all the other upturns were also due to human interaction and we have no scientific evidence of advanced civilizations living hundreds of thousands of years ago.
so we can only go by what we supposedly already know about everything there is and ever was.
and we can feel comfortable about that vast amount of knowledge and all the books that support the knowledge as we freeze to death in our homes because of global warming.
3/4 inch of dust build up on the moon in 4.527 billion years,LOL and QM is fantasy science.
Paul, you should learn about the evolution of "interglacial soils," along with what the mastedons and giant beavers were doing to those soils, back in those periods you are wondering about. Note: Interglacial soils are also called mollisols, chernozems, Temperate-Zone soils, or good agricultural soils.
Originally Posted By: paul
"I would say that there is something else other that the orbit that causes temperature changes and according to this graph and the vastness of human knowledge it certainly is not human interaction."
Your certainty is impressive! ...you must be right (and all those others must be wrong).
...it must just be a big coincidence....
~
Pyrolysis creates reduced carbon! ...Time for the next step in our evolutionary symbiosis with fire.
methane kind of hits the nail on the head , wouldnt you say?
what do you think caused the upturn in methane 5,000 years ago?
can I suggest a world full of rotting corpses?
we know that apx 11,000 years ago it was a methane release that brought a end to the last ice age , but the upturn at 5,000 years ago is much greater than the one at 11,000 years ago according to the above graph.
3/4 inch of dust build up on the moon in 4.527 billion years,LOL and QM is fantasy science.
the global warming hypist ( I was once one of them ) for some reason believe that we should reduce the amounts of carbon dioxide and methane in our atmosphere.
I believe that these gases are the force that has brought about our somewhat stabilized warm climate.
these gases are mostly due to rotting plants and animals and rotting life in general through decomposition ,flatulence , excrement , breathing , etc... LIFE!
all the wildfires that we see occurring around the globe are removing a lot of the natural methane that warms the climate.
but we just let them burn out on their own.
and we spend billions on complaining about carbon dioxide which is a much less warming gas.
so , if you want to understand anything in science that involves climate just read a main stream science approved article and form an opinion on what the article is claiming that causes the warming , then simply know that what the article is claiming is completely backwards.
3/4 inch of dust build up on the moon in 4.527 billion years,LOL and QM is fantasy science.
global warming would mean mostly warming. global cooling would mean mostly cooling. climate change would mean warming to cooling to warming to cooling etc...
global cooling seems to be the better choice to use because the globe has been mostly cooling for 10,000 years.
climate change would suggest that there has not been a steady cooling , but thats just not the case , nor has there been a steady warming.
3/4 inch of dust build up on the moon in 4.527 billion years,LOL and QM is fantasy science.
some of the fema camps that have been built all over the united states have really large heating systems in them , and are located along rail roads and they have windsocks for helicopter landings.
could it be that the us government knows were going into an ice age and these camps really are there to evacuate people who are in cities that have basically frozen over?
I know it sounds opposite from what we normally hear about the fema camps , but just think about it awhile.
has the government ever kept secrets from its citizens?
would they want to start alarming people?
and why all the underground bases if they think the oceans will rise?
3/4 inch of dust build up on the moon in 4.527 billion years,LOL and QM is fantasy science.
some of the fema camps that have been built all over
FEMA camps? I haven't seen any FEMA camps. Now I live close to the local Red Cross headquarters and they have a lot of portable shelters. They are trailers stuffed with the stuff to put together a refugee shelter when there is a disaster of some sort. It depends on using existing facilities, such as school gyms and so forth.
Bill Gill
C is not the speed of light in a vacuum. C is the universal speed limit.
that really is a curiosity that fema has so many places for refugees , you would think that they are expecting a lot of refugees.
its nice that we do have these camps and places to house refugees in case of a disaster because just think about Katrina we had these refugee camps then , just ask anyone of the Katrina refugees that were housed inside them.
Im guessing ( zero )
or the tens of thousands of mobile homes that fema purchased just ask the auction attendees who purchased these new condition mobile homes after Katrina , they will tell you how many refugees actually used these mobile homes.
Im also guessing ( zero )
if its not ( zero ) then its most likely below 1% of them.
so that kind of leaves the reason for these camps wide open.
have any of the old school yards been fitted with razor wire in your area?
heres a video that shows the large furnaces that have been installed into buildings that never had needed heat before.
maybe it really will be used to repair the trains that will be needed to move the refugees out of the frozen cities because the roads are all iced up and bottlenecked with stalled cars.
3/4 inch of dust build up on the moon in 4.527 billion years,LOL and QM is fantasy science.
Out of curiosity I tried the link you posted. One of the places mentioned, Bay City, MI, I am quite familiar with. The description reads "Classic enclosure with guard towers, high fence, and close to shipping port on Saginaw Bay, which connects to Lake Huron. Could be a deportation point to overseas via St. Lawrence Seaway”.
The location given is the intersection of Columbus Ave and Washington Ave. I drive by there about once a week and have never seen anything as in the description. No guard towers and no high fence. It is about 5 miles from the Saginaw Bay though.
On the 4 corners of that intersection there is an ambulance garage, a bakery, a neighborhood park and a tavern parking lot.
the tens of thousands of mobile homes that fema purchased just ask the auction attendees who purchased these new condition mobile homes after Katrina , they will tell you how many refugees actually used these mobile homes.
Yep, that was a major boondoggle. Some of the mobile homes were issued to Katrina survivors, but a lot of them never left the staging areas. Of course after they had been sitting in the Sun for a few months without being ventilated they mostly had unhealthy levels of formaldehyde in them, so that kind of messed up distribution plans. That is what happens when you don't properly ventilate new mobile homes.
Of course I don't think anybody can in any way claim that FEMA, or much of anybody else, did much of anything right with Katrina.
Bill Gill
C is not the speed of light in a vacuum. C is the universal speed limit.
Pokey, how could you be so naďve? Do you not realise that FEMA have access to cloaking technology? Obviously, the camp is hidden and what you are seeing are holographic projections. Not until you can accept this and ask how many other cloaked facilities there might be will you even be able to begin to take action to protect yourself and those around you.
It’s all an illusion. Even FEMA is a front behind which the real threat hides. The real “shadow government” is the CDC. It is they who have overt detention camps and the power to detain vast numbers of US citizens.
There is a strong possibility that it is the zombie virus that will be used by FEMA once the CDC have perfected an antidote. The virus will then be released, providing an excuse to round up millions of people, who will disappear into cloaked camps and never be seen again. The antidote will be given to selected people who will then easily take over the country, and subsequently, the world.
"Do you not realise that FEMA have access to cloaking technology? Obviously, the camp is hidden and what you are seeing are holographic projections. Not until you can accept this and ask how many other cloaked facilities there might be will you even be able to begin to take action to protect yourself and those around you.
It’s all an illusion."
Bill S,
Would that be Classic cloaking, holographic projections and illusion, or Quantum?
There is a strong possibility that it is the zombie virus that will be used by FEMA once the CDC have perfected an antidote. The virus will then be released, providing an excuse to round up millions of people, who will disappear into cloaked camps and never be seen again. The antidote will be given to selected people who will then easily take over the country, and subsequently, the world.
well , I certainly couldn't offer a valid argument to that Bill S , and it makes sense because zombies don't have rights and this way the globalist scum bags who are intent on attaining a global power over the inhabitants of the globe will be able to impress upon the global civil population the idea of justified mass slaughter of the unfortunate yet well planned zombie population and this way once again as has always been the norm throughout history the tyrannical globalist scum bag engineers of evil and masters of death will have used fear to cause humans to murder other humans.
all this evil and death played out by the uninformed gullible actors on the stage inside the theatre of the most evil one from whom they have received their appointed measure of power so that the globalist excrement of the earth can have more power to give to the most evil one when he needs more power.
heres a video that shows the military training to extract an uninfected civilian who was possibly the one who had delivered the medication that infected the civilian populace in the area of operation.
the military cant just train in the killing of civilians so they make the civilians look like zombies , and after all a mass of hungry sick and desperate civilians might well look like and even act like zombies.
3/4 inch of dust build up on the moon in 4.527 billion years,LOL and QM is fantasy science.
I found this video and it seems to fit into the direction that this thread has taken , so I thought I would post it before the thread becomes redirected.
3/4 inch of dust build up on the moon in 4.527 billion years,LOL and QM is fantasy science.
“I don't think this lets us off the hook of explaining how Antarctica's sea ice is expanding in a warming world,” says Ted Scambos, a glaciologist at the National Snow and Ice Data Center in Boulder, Colorado.
There is, however, widespread agreement that the paper demonstrates the importance of detailed recording of updates. In that regard, Holland calls the study “an excellent piece of scientific vigilance”.
vigilance
back to real science anyone?
3/4 inch of dust build up on the moon in 4.527 billion years,LOL and QM is fantasy science.
"I don't think this lets us off the hook of explaining how Antarctica's sea ice is expanding in a warming world," says Ted Scambos, a glaciologist at the National Snow and Ice Data Center in Boulder, Colorado.
There is, however, widespread agreement that the paper demonstrates the importance of detailed recording of updates. In that regard, Holland calls the study “an excellent piece of scientific vigilance”.
Paul Holland, an ocean modeller with the British Antarctic Survey in Cambridge, UK, calls the overall growth figure a distraction, and relatively modest. What truly stumps scientists, he says, is the fact that Antarctica experiences huge ice losses and competing gains in different regions, a pattern that is unaffected by this study.
...But that "pattern" (of competing gains and losses) was predicted back in the early 1990s! Maybe they missed some notes.
From: Oxford Monographs on Geology and Geophysics no.16; Paleoclimatology; Crowley & North; 1991.
[Section 14.2.1 Regional Responses to a Greenhouse Warming]
"Although the East Antarctic Ice Sheet could grow during the initial stages of a greenhouse warming, it is possible that melting could occur if CO2 values reached very high levels. Since CO2 doubling studies indicate winter warming around coastal Antarctica of 8-14 C degrees (cf. Fig. 2.12), much higher CO2 levels could tilt the mass balance of the ice sheet from accumulation to ablation." -p.258 ===
I think the entire 21st century will qualify as the "initial stages of a greenhouse warming" event, as this book speaks about it. In the news, when they talk about "Antarctica gaining ice," they mean EAST Antarctica (as predicted by global warming theory, back in the early 1990s). However, West Antarctica is still warming and losing ice ...in response to greenhouse warming.
~
Pyrolysis creates reduced carbon! ...Time for the next step in our evolutionary symbiosis with fire.
have you considered that the new waves are causing the sea ice to break up in the summer time?
I mean until recently the sea ice hasn't been breaking up during the summer time , so would it be reasonable to think that millions of pounds of water pushing up from underneath and washing up over the top of an ice sheet (depending on the height of the ice sheet of course) could have some tiny amount of force that could possibly break up the ice sheet?
once broken up by the waves the chunks of ice would be surrounded by warmer water that does not reflect the heat from the sun which melts the ice.
it cant be warmer temperatures because the temperatures aren't increasing according to the increasing amount of snow and ice accumulating on the artic and surrounding land.
we also are experiencing the effects of storms further south of the artic , and plenty of them.
3/4 inch of dust build up on the moon in 4.527 billion years,LOL and QM is fantasy science.
it took a while to find an image to put up that didn't look skewered to fit into a cause or a groups agenda.
here is a graph that shows the lag time before CO2 levels follow the temperature levels. this clearly shows that CO2 does not cause temperature changes , unless CO2 levels transport themselves into the future somehow.
we would need to check this using QM math to find out if this has already been claimed as a quantum effect.
since it took such a long time to find a image to use I decided that I needed to copy the image to my hard drive.
after all it is from a government web site ( EPA ) and if anyone would want to skewer data in order to gain income from CO2 taxes it would be the government.
so , I copied it just in case they decide to take it down or skewer it to fit into any tax purposes.
I actually like the EPA !!! but as in all govt agencies , they too have outside influences.
3/4 inch of dust build up on the moon in 4.527 billion years,LOL and QM is fantasy science.
like I said a few years back CO2 levels follow Temperature levels , this video shows that the CO2 following occurs apx 800 yrs after temperature !!
it took a while to find an image to put up that didn't look skewered to fit into a cause or a groups agenda.
here is a graph that shows the lag time before CO2 levels follow the temperature levels. this clearly shows that CO2 does not cause temperature changes, unless CO2 levels transport themselves into the future somehow.
...or perhaps the CO2 feedbacks "transport themselves into the" different hemispheres of the planet ...at different rates. ===
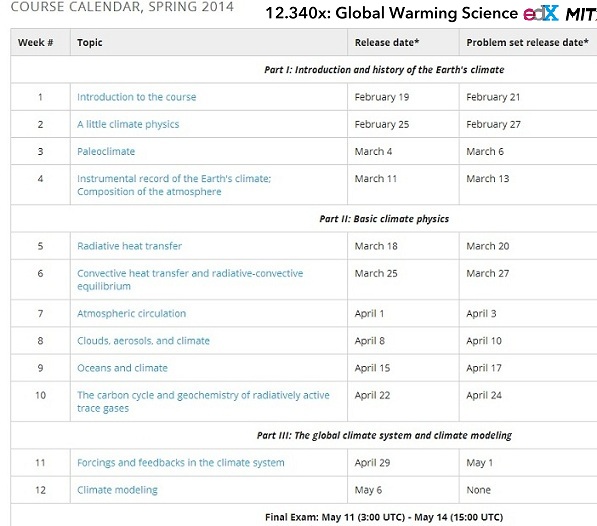
Gosh Paul, if you had a question about the Temp/CO2 lag, you should just ask; there is a lot of evidence (and better resolution graphs) out there. The 'lag' is also one of the points we covered in this EdX class on climate change, which MIT is now offering online, that I took last semester (see certificate at: https://s3.amazonaws.com/verify.edx.org/downloads/950c5511765d4c3fb39f5ecf5cf7e4b2/Certificate.pdf).
Total enrollment: 14,395 / Final enrollment: 10,789
Certificates awarded: 452
…it is a good idea to learn the mainstream science, if you want to proudly debunk it. ===
Quoting from the instructor....
Quote:
who is the Cecil and Ida Green Professor of Atmospheric Science in the Department of Earth, Atmospheric and Planetary Sciences at MIT. He obtained his PhD from MIT in 1978, and returned as faculty in 1981. His research investigates fundamental aspects of the fluid dynamics of the atmosphere, in particular tropical cyclones (a.k.a. Hurricanes or Typhoons) and tropical circulations in general.
In paleoclimatology, and just from thinking about the continent/ocean distributions, there is plenty of evidence to explain why the Northern and Southern Hemispheres don’t always act, or respond, in the same way. But it is good you’ve also got solid evidence from those EPA postings. So to recap, the mainstream scientific view is that:
“Antarctic temperatures varied in sync with CO2, and global temperatures …lagged a little bit behind the rise in CO2.”
~
Pyrolysis creates reduced carbon! ...Time for the next step in our evolutionary symbiosis with fire.
Paul, that information validated what you'd been saying about the lag pattern, so I'm not sure what you're objecting to; but whatever....
Originally Posted By: paul
LOL. Your graph doesn't show the famous spike in CO2 there sam.
in fact at 10 kyrs it shows a decrease in CO2 and a corresponding increase in temperatures!
care to explain that one?
...I'm not familiar with your "famous spike in CO2" reference either, for that time period; so sorry. ===
But as to the 10,000 yr mark, where CO2 begins declining --as expected geologically-- you're right; something else (such as deforestation, methane, and/or NO2) seems to have entered the picture and started offsetting the expected decline in temperatures ...especially after the dawn of the Bronze Age.
...plus, these little graphs add on the most recent few thousand years of GHG levels, for those greenhouse gases, which were not shown in the 'lag' graph that you replied about.
~
Pyrolysis creates reduced carbon! ...Time for the next step in our evolutionary symbiosis with fire.
...I'm not familiar with your "famous spike in CO2" reference either, for that time period; so sorry.
its the same spike as in the image you posted below , it just happens to be in a much smaller scale.
pictures are nice to have when you need to make a specific point , but lets consider real world events that would cause CO2 to increase...
temperatures rise.
the number of plants rise because of the warmer temperatures. the number of animals in the oceans rise because of the warmer water.
the number of animals in the ocean and on the land rises because theres more plants as food and theres more sea food for sea animals.
animals exhale CO2.
warmer = more life = more CO2.
can this work in reverse?
as in...
more CO2 = more life = warmer
you must have a reason for more CO2 what is it?
the levels of CO2 rises because of _________.
120,000 years ago , as is depicted in the above graph. temperatures were highest , there was then a lag time before CO2 levels reached their highest for that period.
if temperatures follow CO2 then why does this graph tell the exact opposite story?
in the graph at apx 30,000 years ago the ice age was at its peak , the temperature difference was -18F , at this point the earth was fully engulfed in an ice age and sea levels had dropped significantly , what do you think could have caused the increase in CO2 levels that you claim are followed by temperature increases?
Im really curious to understand why you think this way.
3/4 inch of dust build up on the moon in 4.527 billion years,LOL and QM is fantasy science.
…it is a good idea to learn the mainstream science, if you want to proudly debunk it.
I think that I would then have an investment that I might need to protect.
but Im glad that you earned your certificate in global warming physics.
I am wondering if your instructor avoided any type of discussion that would have been focused on the overall physics of global warming of the entire recorded history of the climate or did he focus mainly on the last few thousand years?
and , did he ever mention volcanic action as being a cause of greenhouse gasses?
or was he mainly concerned with human intervention as being a cause of CO2.
because , I have checked the image you posted below against several long running volcanoes and calderas and I find the years seem to match the CO2 increases in the image below for the Vesuvius eruptions but your graph seems to stop at the 6000 year mark , why does the graph stop at the 6000 year mark?
is this an example of cherry picking data to fill a basket full of cherries to give to the public?
It was then built up by a series of lava flows, with some smaller explosive eruptions interspersed between them. However, the style of eruption changed around 19,000 years ago to a sequence of large explosive plinian eruptions, of which the 79 AD one was the most recent.
I was going to compare santorini to the graph but the graph stopped before I had the chance!
3/4 inch of dust build up on the moon in 4.527 billion years,LOL and QM is fantasy science.
...I'm not familiar with your "famous spike in CO2" reference either, for that time period; so sorry.
its the same spike as in the image you posted below , it just happens to be in a much smaller scale.
Oh! That spike (today's famous hockey stick 'blade')! No wonder I didn't recall any famous spike from "that time period" covered in the graph you were asking about. So, glad you figured that out ...and can see it hasn't disappeared. ===
Originally Posted By: paul
pictures are nice to have when you need to make a specific point , but lets consider real world events that would cause CO2 to increase...
temperatures rise. the number of plants rise because of the warmer temperatures. the number of animals in the oceans rise because of the warmer water.
the number of animals in the ocean and on the land rises because theres more plants as food and theres more sea food for sea animals.
animals exhale CO2.
warmer = more life = more CO2.
can this work in reverse?
as in...
more CO2 = more life = warmer
you must have a reason for more CO2 what is it?
the levels of CO2 rises because of _________.
This overly simplified picture should make you wonder.
...By that reasoning I wonder also ...if "the number of plants rise because of the warmer temperatures," then why doesn't that offset the rise, as more "animals exhale CO2." ===
Originally Posted By: paul
120,000 years ago, as is depicted in the above graph. temperatures were highest, there was then a lag time before CO2 levels reached their highest for that period.
if temperatures follow CO2 then why does this graph tell the exact opposite story?
in the graph at apx 30,000 years ago the ice age was at its peak , the temperature difference was -18F , at this point the earth was fully engulfed in an ice age and sea levels had dropped significantly , what do you think could have caused the increase in CO2 levels that you claim are followed by temperature increases?
Im really curious to understand why you think this way.
What are you, deaf or blind or just feigning ignorance? You are looking at graphs, which are comparing Antarctic readings and global readings ...but “Antarctic temperatures varied in sync with CO2, and [while] global temperatures lagged a little bit behind the rise in CO2.” –Prof. Dr. Kerry Emanuel, 2014. ===
Paul, historically "...the levels of CO2 rises because of _________" ...Milankovitch (orbital) 'forcing' cycles ...and associated feedback forcings.
Paul, the planet's albedo (snow/ice cover) has historically been especially sensitive to the July insolation at 65° N. Latitude.
So if the planet tilts just right, in some cycle, then (historically, over the past few million years), 'forcing' of the climate has ensued.
~
Pyrolysis creates reduced carbon! ...Time for the next step in our evolutionary symbiosis with fire.
You are looking at graphs, which are comparing Antarctic readings and global readings
do you have a graph available that shows what you want a graph to show , other than the graph that you showed earlier that only has a 16 thousand year span that reflects your temperature following CO2 proposition?
I can probably guarantee you that if there is a period where Temperature increases actually follow CO2 increases it will most likely be due to CO2 released by volcanic action.
BTW , please try to get a graph that will start today and go back in time at least 100,000 years.
maybe you can find one that will show both the arctic and Antarctic CO2 levels along with global temperatures.
good luck.
3/4 inch of dust build up on the moon in 4.527 billion years,LOL and QM is fantasy science.
…it is a good idea to learn the mainstream science, if you want to proudly debunk it.
I think that I [A big conspiracy] would then have an investment that I might need to protect.
but Im glad that you earned your certificate in global warming physics.
I am wondering if your instructor avoided any type of discussion that would have been focused on the overall physics of global warming of the entire recorded history of the climate or did he focus mainly on the last few thousand years?
...The class covered the whole 4.5 billion years of biogeochemical evolution for the planet, and the physics for heat distribution and balance, all of which is what generates the climate. But I can see how, since they didn’t call the class “Climate Science,” you could think the focus was only on global warming. I think the title was designed to attract the most interest.
But here is what their syllabus looked like: …click to enlarge, or there is a text version, if that’s still too unreadable.
I think they were perhaps “screening” for some likely ‘best prospects’ to help them wrangle, and improve, their current climate models; since most of the homework was geared toward deriving or “proving” or demonstrating how models work for each topic, by using standard physics and thermodynamics, and calculus ...or what they called “ordinary differential equations” ...which the syllabus said we'd only need occasionally (yea, on part of almost every section)!
Originally Posted By: paul
and , did he ever mention volcanic action as being a cause of greenhouse gases?
Of course, Paul, volcanoes are one of the major climate forcers; and with multiple effects.
Originally Posted By: paul
or was he mainly concerned with human intervention as being a cause of CO2.
He is “mainly concerned” with reality …and learning how to better model our circumstances.
Originally Posted By: paul
because , I have checked the image you posted below against several long running volcanoes and calderas and I find the years seem to match the CO2 increases in the image below for the Vesuvius eruptions but your graph seems to stop at the 6000 year mark,
why does the graph stop at the 6000 year mark?
is this an example of cherry picking data to fill a basket full of cherries to give to the public?
.... I was going to compare Santorini to the graph but the graph stopped before I had the chance!
...you ask "why does the graph stop at the 6000 year mark?"
Paul, you are seeing conspiracies where none exist. The picture isn’t from the class, though they did use it in one lecture. The picture is from some other scientific source (Shakun et al., 2012 iirc). That is the way science works; it builds on the provisionally vetted work of others.
Too bad they didn’t know what you thought was important.
...but as they state in their [free] abstract:
“Here we construct a record of …the last (that is, the most recent) deglaciation.”
Their focus is on then (and the few thousand years on either side of 'then'), rather than now. Does that make sense to you, or do you still see it as cherry picking the data? ===
It was then built up by a series of lava flows, with some smaller explosive eruptions interspersed between them. However, the style of eruption changed around 19,000 years ago to a sequence of large explosive plinian eruptions, of which the 79 AD one was the most recent.
....
...very interesting!
There are plenty of very high-resolution records for the period you are wondering about, if you want to focus on that period and look for patterns. But that wasn’t the purpose of Shakun’s paper.
Maybe this Vesuvius record will help you see a pattern for the period you are interested in: Gosh, it looks as if maybe the ice-age part of the cycle keeps the volcano quiet, but that the volcano gets more/differently active when a 'warmed up' climate also warms up the oceans and the crust of the planet ...but when it is more likely topped with ice, it is quieter, more effusive, and/or the lateral vents are preferentially active. ===
But seriously now folks... Paul, do you know about Milankovitch “forcing” ...of the climate, and those Milankovitch (or orbital) cycles?
Do you know how the orbital forcing compares, and contrasts, with greenhouse gas forcing?
Originally Posted By: fyi
Orbital forcing doesn’t change the average incoming energy, but it does change the distribution of that average incoming energy. GHG forcing does change the overall balance of that average incoming energy.
...or about why different hemispheres respond to change differently, or why the different oceans have different salinities and different temperatures?
~
Pyrolysis creates reduced carbon! ...Time for the next step in our evolutionary symbiosis with fire.
or do you still see it as cherry picking the data?
sam , when you posted the image below , I had just posted that CO2 increases lag behind Temperature increases by apx 800 years and my image spanned 800,000 years.
your image had a span of only 16,000 years and was an obvious attempt to support your proposal that Temperatures lagged behind CO2 increases , thus my claim that cherry picking data was in play.
I may have misunderstood your post , you may have simply been showing that volcanic activity can cause CO2 levels to lead Temperature levels.
even so , what it all boils down to is that temperatures are not increasing , temperatures are decreasing even though mans contribution of CO2 through the use of fuels is 1000 times the amount of global CO2 produced by volcanic activity per year.
CO2 is not causing warming it is causing cooling...
if you need a reason to reduce the CO2 emissions then you should focus on the obvious ability of CO2 to cause the earth to cool.
I would say that focusing on increasing methane to warm the planet would be the choice.
and of course a balance of methane when the right temperature has been achieved.
but I don't really think that we can get ourselves out of this backwards way of thinking that we have gotten ourselves into quick enough to actually accomplish a balance.
think about how the world is using methane as a energy source today...
landfills now burn the methane to make energy.
3rd world nations homes have methane digesters to make methane as a fuel.
fires destroy much of the natural methane.
man really is changing the climate , we just have the wrong information.
3/4 inch of dust build up on the moon in 4.527 billion years,LOL and QM is fantasy science.
here is a follow up on the july cold weather in the U.S. from the weather channel.
Quote:
Temperature records set way back in the 1880s were broken as unusually cool air blanketed a large part of the country in the heart of summer. It felt more like fall from the Upper Midwest into the South this past week.
An unusually strong cold front for July began its southward plunge on Monday, July 14. The result was below-average temperatures for much of the central and eastern U.S.
(MORE: Coldest July Days Ever Recorded in America)
All-Time Record Low July Temperatures
Many all-time record low temperature records for the month of July were broken. On Wednesday morning Joplin, Missouri tied its all-time July record low of 50 degrees.
The state of Oklahoma recorded its coolest July day on Thursday with an average temperature of 63.6 degrees. The previous record was 66.3 degrees set on July 12, 1953. The average temperature is found by adding up all the high and low temperatures across the state, then dividing the total by two and then dividing by the number of reporting stations.
On Friday, all-time record coolest high temperatures for the month of July were set across much of the South. A few of the cities that set records are Memphis, Tennessee; Greenwood, Mississippi; and Longview, Texas.
Based on the analysis of entrapped air from ice cores extracted from permanent glaciers from various regions around the globe, it has been demonstrated that global warming began 18,000 years ago,
--->the many eruptions of Vesuvius !!!<---
accompanied by a steady rise in atmospheric carbon dioxide. Humans are quite likely the cause of a large portion of the 80 ppm rise in CO2 since the dawn of the Industrial Revolution, and from a distance, it looks possible that increasing CO2 may cause atmospheric temperatures rise. However, on closer examination it is seen that CO2 lags an average of about 800 years behind the temperature changes-- confirming that CO2 is not the primary driver of the temperature changes.
The real signature of greenhouse warming is not surface temperature but temperature in the middle of the troposphere, about 5 kilometers up. If global warming is occurring from an increasing greenhouse effect due to CO2 additions by humans the temperature of the middle troposphere should be warming faster than Earth's surface (1,2). However, the opposite has been happening--- which suggests either the surface temperature records are in error or natural factors, such as changes in solar activity, may be responsible for the slight rise in surface temperatures (approximately 0.6° C, globally) that appears to have occurred over the past century.
Interestingly, from 1999 to the present the temperature of the mid troposphere has actually decreased slightly and surface temperatures have ceased warming -- even as CO2 concentrations have continued to increase (3). This should not be happening if CO2 increases to the atmosphere are the primary driver of global warming
I have noticed as you may also have noticed in the above graph at apx 147,000 years ago also that is as far back as the CO2 data on the graph goes there was an event that caused CO2 levels to lead Temperature levels , this is most likely due to volcanic action.
ok , I found it I think , it was a caldera , the Cos Caldera
Quote:
The Nisyros volcano is the most active remain of the Cos caldera that exploded aprox. 150.000 years ago.
here is a website that talks about the 800 year lag time from temperature increase to CO2 increase. http://www.geocrap....
...Sorry Paul, that is (I feel certain) a well-known AGW denialist website.
I first ran across that site (iirc) back in '08 or '09, while searching for graphs that showed the evolutionary and climate history of the planet. They have neat pictures and graphics, which are usually valid and unmodified, and from valid scientific sources.
But their "conclusions" are editorialized claptrap opinions. Don't get trapped! Look, but don't leap!
So even when they use valid scientific data/graphs, they only post their own (denialistically) 'logical' contusions; instead of posting the freely available conclusions, which experts have written specifically to accompany the original data/graphs. So I hope they are ‘well known’ for being a slick, junk-science website ...albiet with useful pictures and graphs!
Your cited site is an extensive site (covering any search on paleoclimate that somebody might try). But they manipulate valid data to "show" how any problem with the climate (which people might search online for information about]) can be viewed as normal and not a sign of any problem.
If anyone knows differently, or my memory is faulty regarding that website's content, please update this WARNING!
~
Pyrolysis creates reduced carbon! ...Time for the next step in our evolutionary symbiosis with fire.
the images they have are valid , but the reasons they give to compliment the images are not scientifically accepted.
personally , I can easily argue with that line of thought.
simply because CO2 levels follow Temperature levels. except when volcanic action is in play.
and for some reason the scientifically accepted reasons never seem to bother explaining why the global ice core data and the images produced from that data clearly show that CO2 follows Temperatures.
but the GW scientist or whatever they think they are expect us to blindly believe that the exact opposite is true.
with this data / evidence in hand it seems more truthful to say that those who believe that CO2 causes warming are the true deniers of the truth.
Quote:
which experts have written specifically to accompany the original data/graphs.
expert at what?
from what I understand the IPCC uses only a tiny fraction of the available experts possibly / reportedly because the remaining majority of experts do not think along the lines that could sustain the existence of the IPCC and its goals or its agenda.
3/4 inch of dust build up on the moon in 4.527 billion years,LOL and QM is fantasy science.
Latvia recorded its highest-ever daytime temperature on Monday, with mercury in the usually nippy Baltic republic hitting 37.8 degrees Celsius (100.4 Farhenheit) in the western port city of Ventspils, state meteorologists confirmed.
The city also saw a record-breaking 36.9 degrees Celsius on Sunday, topping a previous high of 36.4 degrees set in the south-eastern city of Daugavpils [west, and 100 miles south of Ventspils] in 1943.
...at the same latitude as Kodiak Island, Alaska! ===
So it all averages out, in the end; nothing new to see here, right?
~
Pyrolysis creates reduced carbon! ...Time for the next step in our evolutionary symbiosis with fire.
that all makes sense , so its like a heat sink only its for carbon and life in general that existed in the lakes before the lakes drained.
and the "ice box" effect locked it up inside the permafrost and sediment.
that definitely was not something I had considered , Im not sure what its impact has been on the overall climate but could it really have a significant effect when considering the amounts of CO2 that humans have released by burning fuels?
we haven't caused a rise in temperatures and we pump 1000 times the amount of CO2 into the atmosphere each year than volcanoes do.
as far as the locked up methane goes , if this permafrost will melt enough to release some of the methane then maybe that will stall the ice age for a while.
3/4 inch of dust build up on the moon in 4.527 billion years,LOL and QM is fantasy science.
...yep; volcanoes are just part of the baseline variance; yet some new complication is afoot! ===
...and back on topic: Alaska also has some record high temps, in the news today. Though the July temperatures anywhere, in any given year, have nothing to do with proving (or disproving) climate change or global warming theory.
The scale of climate is too long (and variable) for "record" temperatures to serve as evidence for those. Nor is global warming theory based on observations about temperatures or any recent temperature trends. It’s just physics ...that informs climate change and global warming theory. ===
...where they mention: “Our estimate of about 160 petagrams [gigatonnes/Billions of Tons] of Holocene organic carbon in deep lake basins of Siberia and Alaska increases the circumpolar peat carbon pool estimate for permafrost regions by over 50 per cent.” ...fyi, that is equivalent to over 500 gigatonnes of CO2!
I have been looking for information on just this subject; since I’m also advocating for building more soil, instead of only cutting emissions ...as a solution to the greenhouse gas problem. ===
...and globally:
Originally Posted By: wikipedia
Soil carbon is the largest terrestrial pool of carbon, containing 2,200 gigatonnes (Gt) of it.[1] Humans increasingly influence the size of this pool. Soil carbon plays a key role in the carbon cycle, and thus it is important in global climate models.
...equivalent to over 8,000 Billion Tons (Gt) of CO2 ...while we worry about emitting an extra 30-40 Gt each year
And that soil carbon is in flux too! Both naturally, and because of anthropogenic land use/land cover changes, soils and soil carbon have recently become significant players in the global carbon cycle. Opportunities abound for offsetting our [relatively] puny problem with CO2 emissions.
~
Last edited by samwik; 08/07/1405:12 PM.
Pyrolysis creates reduced carbon! ...Time for the next step in our evolutionary symbiosis with fire.
Interesting article, but highlights the confusions that can arise as terms cross the Atlantic. Here, a ton is bigger than a tonne.
"Over the last two decades, about 295 billion tons (269 billion metric tons) of ice is melting each year on average because of human causes and about 130 billion tons (121 million metric tons) a year are melting because of natural causes, Marzeion calculated."
That's a pretty blaring typo. Someone might wanna let that writer know. Talk about adding confusion. 130 billion tons converts to 118 billion tonnes, not million.
...details, details.... 1 kilo = 2.20462 pounds. But searching online:
"unit of weight in the avoirdupois system equal to 2,000 pounds (907.18 kg) in the United States (the short ton) and 2,240 pounds (1,016.05 kg) in Britain...."
Nothing is simple, eh? ===
"The tonne (British and SI; SI symbol: t) or metric ton (American) is a non-SI metric unit of mass equal to 1000 kilograms; it is thus equivalent to one megagram" -wikipedia ...so 2,204.62 pounds?
So a metric ton (tonne) is neither a short ton (American) nor a long ton [or imperial ton] (British), it seems. "A long ton is 20 hundredweight."
~
Pyrolysis creates reduced carbon! ...Time for the next step in our evolutionary symbiosis with fire.
"In India’s Western Himalayas, changes in altitude are so dramatic and steep that alluvial grasslands, subtropical forests, conifers and alpine meadows lie stacked almost on top of each other, producing a spectacular range of vegetation. Now, the myriad plants that inhabit these mountains are migrating upwards because of climate change — and some are in danger of being lost before anyone has even recorded their existence."


 …
…

