Isn't this about an increase of 20 degrees C (68F), not an actual temperature of 20C?
Edit (thanks redewenur): an increase of 20C would be an increase of 39 degrees F, not 68.
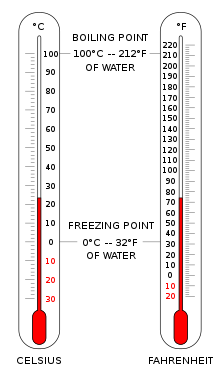
20 C is 68 F
Im really surprised that you and red didnt know that.
a simple google search would have shown you.
the graph would resemble more of a zig zagged line or curve.
1950–2000 39.1 9.1
1900–1950 29.1 6.8
1850–1900 18.0 4.2
1800–1850 14.2 3.3
1750–1800 10.0 2.3
1700–1750 7.6 1.8
1650–1700 4.9 1.1
1600–1650 3.5 0.8
1550–1600 1.9 0.4
1500–1550 1.0 0.2
more like a ever increasing curve with a steeper curve at the end.
I dont see any straight line for the hockey stick handle.
Samwik , all those numbers are really nice , but so that
myself and readers might further understand would you mind converting those numbers to ground temperature changes.
I'll bet there is only a degree or two change if that much.


