Demographics of Commuting in Greater Boston For Sale

When you click on links to various merchants on this site and make a purchase, this can result in this site earning a commission. Affiliate programs and affiliations include, but are not limited to, the eBay Partner Network.
Demographics of Commuting in Greater Boston:
$10.00
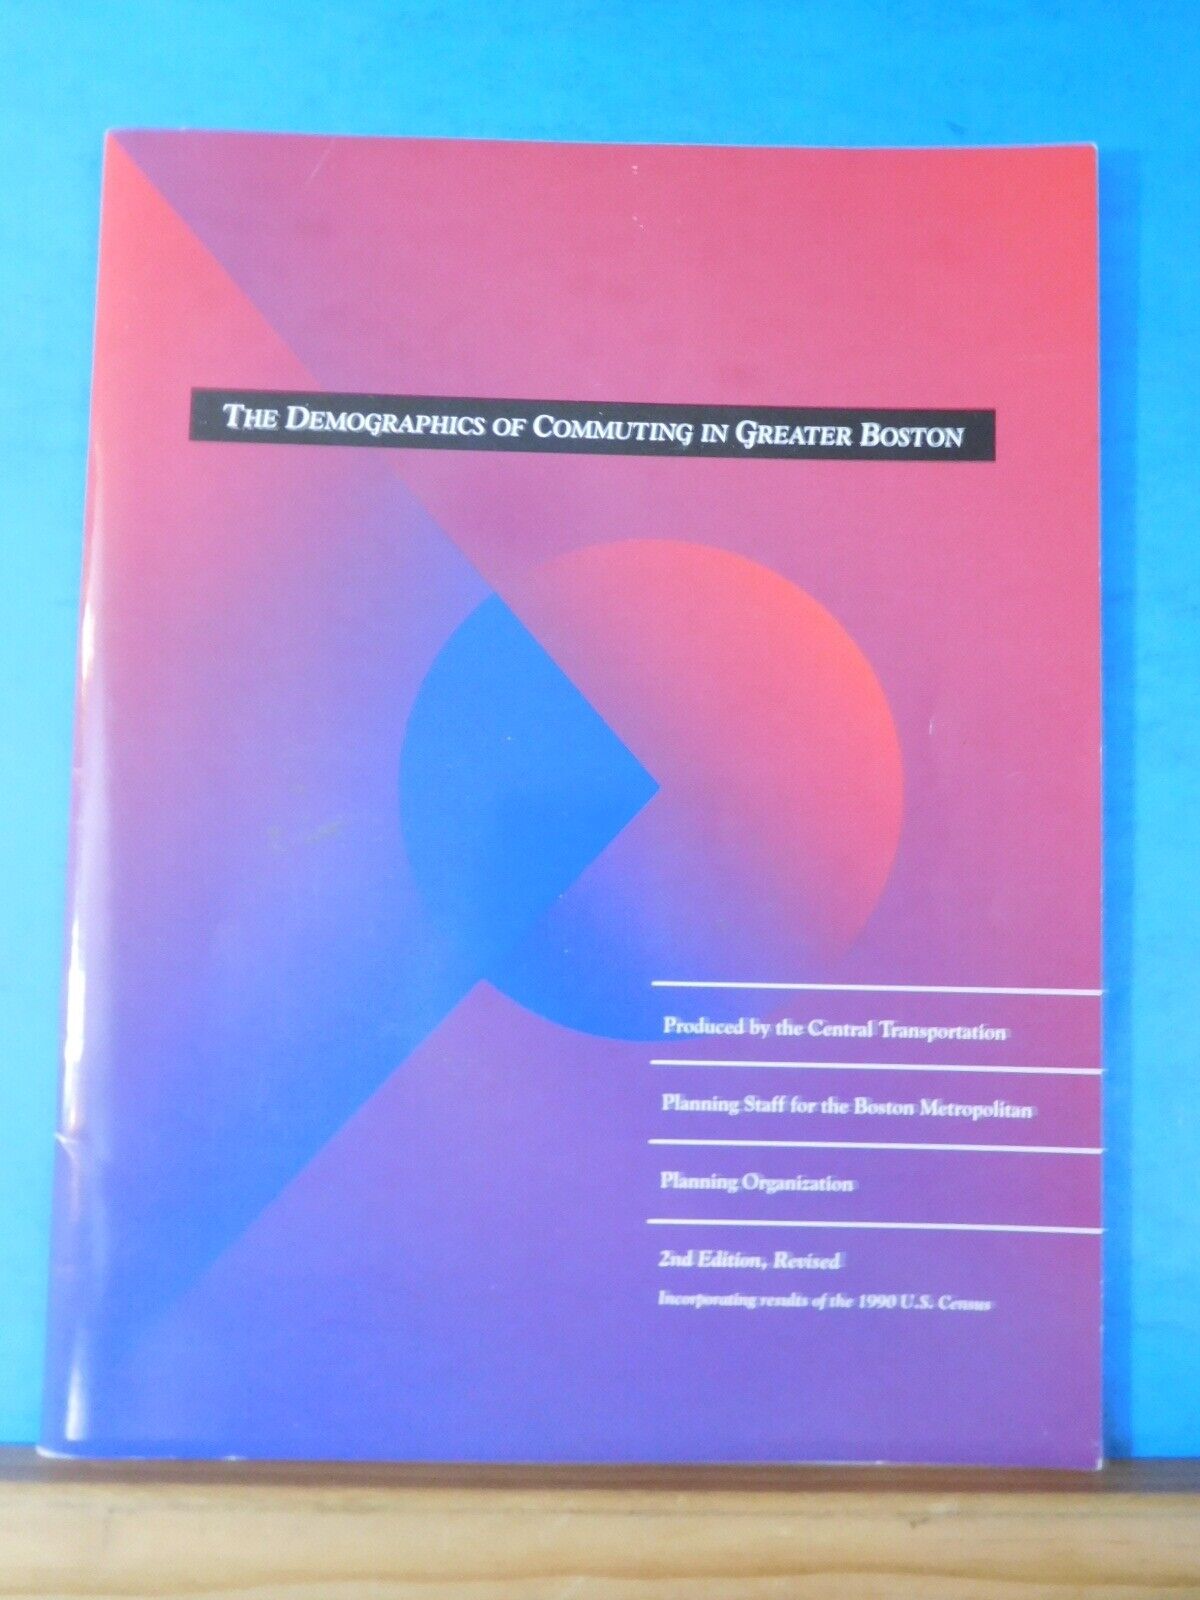
RailroadTreasures offers the following item: Demographics of Commuting in Greater Boston Demographics of Commuting in Greater BostonSecond Edition REVISED incorporating results of the 1990 US CensusCopyright 1989, August 1998Commuting is at the core of most of the issues of transportation, for it is the morning and afternoon peaks, the rush hours every weekday, which determine what the capacity of most of our roads and transit facilities should be.* The metropolitan transportation system as a whole must be able to serve the peak volume, not merely the average volume spread over an entire day. Thus, at the basis of any transportation plan must lie an understanding of the patterns of commuting in the metropolitan area. The object of this document is to explain the pattern of commuting seen in the Boston region today by looking at the area's demographic trends since 1950.During the decades following the end of the Second World War, sweeping changes in land use and development occurred across the region. New zoning codes and the construction of new expressways served to open up large tracts of land to new housing development. Thousands of families pursued the "American Dream" to a suburban house and a new car, leaving behind the crowded, old cities. Later, jobs followed the people to the suburbs, as commercially zoned land (originally intended for warehouses) was developed for office parks. The effect of these two migrations was a tremendous increase in suburb-tosuburb commuting.While suburban commuting might have led to less congestion in the region, as commuters shifted from crowded routes converging on the urban core to wide-open suburban roads, the amount of development that occurred in suburban areas soon overwhelmed the available road space. Because the style of most suburban development discourages ridesharing and mass transit, almost all suburb-to-suburb work trips occur in single-occupant vehicles. Highways which were intended as an alternative to congested urban roads soon became congested themselves, filled with cars carrying one person each, travelling from a suburban home to a suburban office.Because Boston's urban core has remained a vital economic center during this period of suburban development, traffic congestion is seen throughout the region, on suburbanhighways and arterial roads as well as on routes to downtown. While mass transit is available to serve trips to the downtown area and thus mitigate congestion on the highways, there are few options for suburban commuters.In attempting to shed some light on the forces which have shaped commuting in the Boston region, this document will first define an appropriate study area and then go on to examine trends in population, housing and employment. Following that portion of the analysis will be a study of actual commuting patterns, highlighting the differences between older cities and newly developed suburbs. Understanding these trends and patterns will be an aid to transportation planners and land use planners in creating policies to help reduce congestion, promote sustainable economic growth and enhance the quality of life for the people who live and work here.
LIST OF FIGURES1Number of Commuters to Boston, 1990 42MPO Commuter Source Area 63Population, 1950 84Construction of the Expressway Network 105Change in Population, 1950-1960 126Change in Population, 1960-1970 147Change in Population, 1970-1980 168Change in Population, 1980-1990 189Median Housing Price, 1990 2010Increase in Number of Housing Units, 1980-1990 2211Change in Number of Jobs, 1980-1990 2412Ratio of Jobs to Housing Units, 1990 2613Percentage of Workers Imported, 1990 2814Motor Vehicles per Capita, 1990 3015Number of Commuters to the Urban Core, 1990 3216Percentage Change in Number of Commuters to the Urban Core, 1980-19903417Change in Mode Share to the Urban Core, 1980-1990 3618Percentage of Commuters to the Urban Core Who Use Transit, 1990 3819Number of Commuters to Waltham, 1990 4020Downtown Waltham vs. Waltham/Route 128: Commuting Patterns, 1990 4221Number of Commuters to Lynn, 1990 4422Number of Commuters to Burlington, 1990 46All pictures are of the actual item. If this is a railroad item, this material is obsolete and no longer in use by the railroad. Please email with questions. Publishers of Train Shed Cyclopedias and Stephans Railroad Directories. Large inventory of railroad books and magazines. Thank you for buying from us.
Shipping chargesPostage rates quoted are for shipments to the US only. Global shipping charges are shown. These items are shipped to Kentucky and then ships them to you. collects the shipping and customs / import fees. For direct postage rates to these countries, send me an email. Shipping to Canada and other countries varies by weight.
Payment options Payment must be received within 10 days. Paypal is accepted.
Terms and conditions All sales are final. Returns accepted if item is not as described. Contact us first. No warranty is stated or implied. Please e-mail us with any questions before offerding.
Thanks for looking at our items.

Related Items:
Vintage Bank of America Branch Expansion California Trends Demographics c. 1945
$41.99
Photo 6x4 Demographics of the village Porthgain c2009
$2.49
Demographics of Commuting in Greater Boston
$10.00


