|
0 members (),
388
guests, and
4
robots. |
|
Key:
Admin,
Global Mod,
Mod
|
|
|
|
Joined: Oct 2006
Posts: 1,164
Megastar
|

Megastar
Joined: Oct 2006
Posts: 1,164 |
I am sorry, but I don't understand. What is an extinction coefficient? The way I see it is CO2 will absorb 100% of the IR radiation at about 15 microns. It is difficult to read from that graph, so for argument's sake, I will say that CO2 will only absorb 30% of the energy at 18 microns. As the concentration increases, more of the 18 micron energy will be absorbed, but the amount absorbed at 15 microns will not change. Is this what you mean by a graph of extinction coefficient? 15, 18 Microns? Huh; are we talking about different graphs? Above is the graph that I'm saying has been relabeled, "falsified" by Archibald, from what I (IMHO) can tell. Do you have a different source for the graph, or any similar graph? I know I'm setting myself up to look like a really stupid, worthless pest; and I'll have to offer some apologies to various folks and sites if I'm wrong about this.... Maybe I should ask for a 12-24 hour grace period (hopefully 4 hours will be enough) to double check that there isn't something obvious that I'm missing. Sure, I'll try that. So to restate: This graph is either a complete theoretical construct, or a relabeled graph of something else (possibly CO2 extinction coeff.); not a graph based on experiment or observations by a citable (or any) source. Thanks,  P.S. Yes, I feel fairly confident of my claim; no more grace period needed. P.S. Yes, I feel fairly confident of my claim; no more grace period needed. ...only found: http://royalsociety.org/downloaddoc.asp?id=1881Temperature change vs CO2 concentration (...but just predictions)
Last edited by samwik; 06/11/08 07:41 AM. Reason: UPDATE: P.S.
Pyrolysis creates reduced carbon! ...Time for the next step in our evolutionary symbiosis with fire.
|
|
|
|
|
Joined: Aug 2006
Posts: 174
Senior Member
|
|
Senior Member
Joined: Aug 2006
Posts: 174 |
The http://www.scienceagogo.com/forum/ubbthreads.php?ubb=showflat&Number=26438#Post26438 has a graph. My description of how CO2 gas concentration is based on that graph and this one that I had linked to:  If that graph is right, then the extinction graph you are talking about also is logical. The first graph on pAZage 9 of your royal society link shows that CO2 to temperature is not linear. That is a start, but what is the relationship at lower concentrations? As well, those graphs are based on the IPCC scenarios. As you say, they are just theoretical predictions from the models. As we discussed on another thread, those predictions are way too high. The biocab site suggests that the radiative forcing of CO2 is much lower than that. Right now I am not interested in the actual number of degrees per CO2 doubling, but in the relationship between them; otherwise, we will be going in circles again.
|
|
|
|
|
Joined: Aug 2006
Posts: 174
Senior Member
|
|
Senior Member
Joined: Aug 2006
Posts: 174 |
Trying again:  Link if the picture does not appear Link if the picture does not appearHere is a link to a physicist that discusses the relationship between CO2 and temperature as logathrimic. Using his Temperature = Temperature0 + ln(1 + 1.2 x + 0.005 x2 + 0.0000014 x3) formula, I made the following spreadsheet:  Where CO2 is the PPM concentration (column V), Temp is in Celcius, and Chg is the temp less the previous temp. Plotting CO2 against Chg, the looks similar to that of the yellow 'extinction' graph. Of course, that is because Ln is in the formula. My version of the formula in open office calc is: =$W$20+LN(1+1.2*V41+0.005*V41*V41+0.0000014*V41*V41*V41)
|
|
|
|
|
Joined: Mar 2007
Posts: 203
Senior Member
|
|
Senior Member
Joined: Mar 2007
Posts: 203 |
samwise.......
you're looking at the estimated/predicted temperature increases vs CO2 increases, including feedbacks.
The graph that John presented was the temperature increases (calculated) vs CO2 increases, without feedbacks.
The italics are the critical difference here.
It's fairly well documented that from first principles, excluding any changes in convection, a doubling of CO2 will yield a temperature increase of 1.1-1.5 degrees C. You have to include some silly positive feedbacks, and minimize any negative feedbacks to get the 6oC increases predicted by some GCMs.
|
|
|
|
|
Joined: Mar 2006
Posts: 4,136
Megastar
|
|
Megastar
Joined: Mar 2006
Posts: 4,136 |
John You missed the "In daylight" part. That is the key. Or is your problem with the 'always' being too strict?
I ignored the "in daylight" part , because for the most part , the air in daylight or at night is warmer than the ground , however in the winter months the air can become colder than the ground and varies with geographical location. but yes I have a problem with people saying always about something that fluctuates such as air temperature , especially when they use something that is more like a always such as ground temperature in their comparison and then reverse the facts to try and prove a point or theory. .
3/4 inch of dust build up on the moon in 4.527 billion years,LOL and QM is fantasy science.
|
|
|
|
|
Joined: Oct 2006
Posts: 1,164
Megastar
|
|
Megastar
Joined: Oct 2006
Posts: 1,164 |
samwise.......
you're looking at the estimated/predicted temperature increases vs CO2 increases, including feedbacks.
The graph that John presented was the temperature increases (calculated) vs CO2 increases, without feedbacks.
The italics are the critical difference here.
I wasn't looking at any graphs until JMR brought up that one logarithmic graph (which I still think is bogus). I only included that Royal Soc. graph (found during 'grace-period' check) because it had the same parameters as JMR's graph.I hope to get the back to the CO2 and IR physical properties soon enough, but I need to respond to this graph stuff first, and compose.... ~Later p.s. For some barely related climate surfings on physical properties of extinction (absorbance) and heating, see:http://www.scienceagogo.com/forum/ubbthreads.php?ubb=showflat&Number=26584#Post26584
Last edited by samwik; 06/12/08 09:57 AM. Reason: add p.s.
Pyrolysis creates reduced carbon! ...Time for the next step in our evolutionary symbiosis with fire.
|
|
|
|
|
Joined: Aug 2006
Posts: 174
Senior Member
|
|
Senior Member
Joined: Aug 2006
Posts: 174 |
I ignored the "in daylight" part , because for the most part , the air in daylight or at night is warmer than the ground , however in the winter months the air can become colder than the ground and varies with geographical location. As well as ignoring the key part of the biocab sentence, you have it exactly opposite. Like I wrote in my 26477 post, the surface heats in sunlight. Whether that surface is the top millimeter layer of a rock, soil, wood chips, or gravel, it heats first. The darker the object, the more it will heat up. As far as the light can penetrate, that is the top layer that heats up. Some of that heat is then removed by the air through convection, conduction or radiation. The rest of the heat will go to warming the ground just below the surface through conduction. The air will always be colder or the same temperature as the surface layer of the ground unless it is night or cloudy AND a warm wind, that was warmed by the surface elsewhere, blows in. The only possible exception I can think of may be snow on the ground that reflects the sun's light.
|
|
|
|
|
Joined: Mar 2006
Posts: 4,136
Megastar
|
|
Megastar
Joined: Mar 2006
Posts: 4,136 |
John Originally Posted By: paul
if I go outside and stick a thermometer in my yard it will read 65 F even if the "air" temperature is 95 F even if the "air" is 45 F the ground is 65 F so the air is always colder must be incorrect.
You cannot use a thermometer. It is the surface layer that gets warm.
I missed your comments above , I guess I didnt scroll down far enought to see it , your reply was directed at samwik. I should pay more attention...LOL I didnt understand that they were refering to only the top layer of soil as they just referenced the "soil" only. and yes the thin top layer of soil could be warmer than the air. from there on down there is heat transfer into the largest heat sink in the world. the earth. and just as soon as the soil gets heated it begins to be absorbed / transfered into the earth , trying to maintain heat on a section of ground is almost impossible.
Last edited by paul; 06/12/08 05:08 PM.
3/4 inch of dust build up on the moon in 4.527 billion years,LOL and QM is fantasy science.
|
|
|
|
|
Joined: Oct 2006
Posts: 1,164
Megastar
|
|
Megastar
Joined: Oct 2006
Posts: 1,164 |
Hey! That's just what I was saying about the graph; someone's taken a graph of the extinction coefficient in an absorbing medium and relabeled it to suite their agenda or "theory."
This all makes sense if you assume that after the IR is absorbed, it is "sequestered" and doesn't heat the atmosphere further. Based on that "theory," one could assume a graph of the extinction coefficient was proportional to the "warming effect." It makes sense, but it's not true; not based on physical reality. === John, About your link to another explanation of the logarithmic effect... see: http://www.scienceagogo.com/forum/ubbthreads.php?ubb=showflat&Number=26614#Post26614Meanwhile, back on topic....Concentration affects how easily heat (a quantum of IR) traverses an absorbing (concentrated or dilute) medium. As I think you've said, it slows the escape of the heat; a higher concentration increasingly retards the IR heat flow. I suspect the term "extinction coefficient" has been taken to mean the point where all of the IR is "soaked up." A better description would be the difficulty (or ease) of transmittance of an IR quantum; how much of the absorbing medium does the quantum need to travel through, before it's likely to be absorbed. I've heard several numbers, between 10 and 100 meters, for the "total" absorption of IR by CO2. Whatever.... Raising the concentration, lowers the distance within which that IR is absorbed. That's why they use the "extinction coefficient" to measure concentration. CO2 that has absorbed IR, then becomes invisible to more IR, so any additional IR is absorbed by CO2 farther away, until it also becomes saturated (heated) by (and then invisible to) the additional IR. Even more IR would be absorbed by CO2 even farther away (through the hot, transparent CO2); and this would continue happening up through the atmosphere until, as the concentration of CO2 became too low, it would radiate away into space. Now this is a good graph (except the "98% of heat" should include the 4.3micron CO2 peak also)! The second graph is especially instructive. 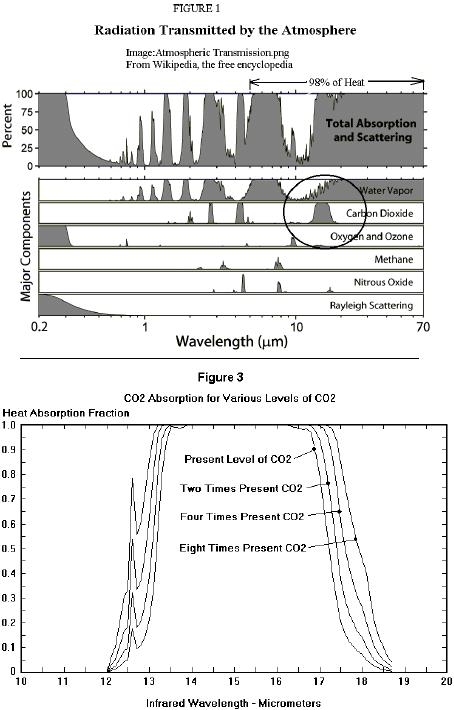 The area under the curve is the heat not escaping into space. Lowering the CO2 concentration would lower the peak until some IR heat escaped into space at that wavelength. As the graph shows, raising the concentration pushes the peak (at that wavelength) up, truncating the top, leaving a wider and wider plateau of absorbed heat not escaping into space. As you'll notice, the side notch (at ~12.6 microns) that absorb only ~20% of the heat currently, absorbs ~80% of the heat at 8 times present levels. Notice the truncated plateau. Currently there is a window at ~13.75 microns, that will be closed by increasing levels of CO2. Now we see from the graph that none of this heat escapes; so why doesn't all the CO2 become invisible as it becomes saturated with IR heat? There is a relaxation time, or a decay rate, measuring how quickly (or slowly) CO2 loses that absorbed quantum. Once it re-emits the absorbed IR, or loses heat through collisions, it is no longer invisible to additional IR, and so can absorb once again. Increasing the concentration, increases the re-absorption of previously re-emitted IR heat quanta, in addition to increasing the transfer of heat through an increased number of collisions. This is a linear relationship; doubling the concentration, doubles the heat lost through collisions. Of the IR heat that is 100% absorbed by the atmosphere (not transmitted into space), it is continually re-emitted and re-absorbed on a fairly local level (as proven by the extinction coefficient); until it is lost, translated into heat via collision with another molecule, allowing subsequent IR heat to be absorbed by the relaxed CO2. If this didn't happen, then some IR heat at that wavelength would escape into space. The logarithmic extinction coefficient, relating absorbance to concentration (in a given distance), has nothing to do with the heating that is linearly related to concentration. There's still the IR sources, collisions, and the changes in frequency that could be discussed; but I wanted to "debunk" that logarithmic graph (and related conclusions) as a good opportunity to examine some of the physics of atmospheric gases. It seems to me that Archibald has taken the extinction coefficient (which approaches low levels within a few centimeters) and extrapolated out to 10 or so meters where the level would be essentially zero; and then he assumed extinction meant no further heating, and thus deduced that further increases in concentration would not appreciably increase the temperature. Archibald indicates there is no basis for his graph when he says "Confirming the logarithmic effect of carbon dioxide is possible using the MODTRAN facility hosted by the University of Chicago." This could be an example of "new physics" worthy of an "IgNobel Prize" in physics. http://improbable.com/ig/ig-pastwinners.htmlY'know, I bet if it's true for CO2, it'd be true for all gases! I can understand why I easily googled this quote, "David Archibald is perhaps the most discredited voice in the world of climate science." His logarithmic graph is "a tissue of statistical sophistry." ...quotes cited on http://www.scienceagogo.com/forum/ubbthreads.php?ubb=showflat&Number=26535#Post26535Archibald seems to have duped the blog, climateaudit, run by Steve McIntyre, the Canadian statistician, with his falsified graph. They should get a physical chemist on their team to vet some of this stuff. John, is it this "logarithmic effect of carbon dioxide" that makes you think CO2 isn't an increasing problem for our climate? Thanks, ~samwik
Pyrolysis creates reduced carbon! ...Time for the next step in our evolutionary symbiosis with fire.
|
|
|
|
|
Joined: Aug 2006
Posts: 174
Senior Member
|
|
Senior Member
Joined: Aug 2006
Posts: 174 |
Samwik seems to be asking me 'what makes me think that CO2 isn't an increasing problem for our climate?' Let's go back to the data. The temperature stopped increasing in 1998. Since 2002, the temperature trend has been negative according to satellite temperature data. Our CO2 levels have been increasing but the temperatures have not followed suit. This is why the IPCC ensemble of models has falsified. Our temperatures are bleow their constant CO2 level scenario. The warming effect, and thus human influence over climate is vastly exaggerated. If CO2 does cause warming at low concentrations, then the relationship must be logarithmic since it has not been causing any warming as of late. To suggest that the relationship is linear, as you do, means that CO2 has almost no warming effect whatsoever at any concentration. About the second graph, it is not about the peak being reduced. It is about the inefficient edges being able to absorb a bit more IR radiation on the edges. This just lowers the 100 or 10 m limit where all IR radiation, that CO2 can absorb, will be absorbed. CO2 that has absorbed IR, then becomes invisible to more IR, so any additional IR is absorbed by CO2 farther away, until it also becomes saturated (heated) by (and then invisible to) the additional IR. Even more IR would be absorbed by CO2 even farther away (through the hot, transparent CO2); and this would continue happening up through the atmosphere until, as the concentration of CO2 became too low, it would radiate away into space. That would be fine if you assume that the CO2 holds the heat for more than a few seconds. The atmosphere is most dense near the ground. Either the CO2 molecule would re-radiate the energy, or it would change its energy level via a collision with another molecule. Canuck's graph suggests that the collisions are frequent enough that none of the 4.3 or 15 micron wavelengths are able to escape to space; therefore, the area under the curve is the IR that gets absorbed before it is converted to another wavelength. Do you have any proof that Motl's formula is wrong?
|
|
|
|
|
Joined: Mar 2006
Posts: 4,136
Megastar
|
|
Megastar
Joined: Mar 2006
Posts: 4,136 |
John , Samwik You guys seem to be hung up on temperature data.  If there ever was any indication of rising temperatures it would be in the amount and location of water vapor ,storms ,tornadoes huricains , and mainly rain. ie...precipitation !! Why do I say this? mainly if the sun is blocked by water vapor / clouds the ground temperature would not show an increase it would show a decrease. why do I say that location is an indication? because clouds need cool air to condense the water vapor into rain. this is why it has been raining so much further north in the U.S. when the earth heats up there is more water vapor / clouds and underneath these clouds there are cooler air temperatures. Link to the info below "The atmosphere's water vapor content has increased by about 0.41 kilograms per cubic meter (kg/m˛) per decade since 1988, and natural variability in climate just can't explain this moisture change. The most plausible explanation is that it's due to the human-caused increase in greenhouse gases."
More water vapor - which is itself a greenhouse gas - amplifies the warming effect of increased atmospheric levels of carbon dioxide. This is what scientists call a "positive feedback."
Using 22 different computer models of the climate system and measurements from the satellite-based Special Sensor Microwave Imager (SSM/I), atmospheric scientists from LLNL and eight other international research centers have shown that the recent increase in moisture content over the bulk of the world's oceans is not due to solar forcing or gradual recovery from the 1991 eruption of Mount Pinatubo. The primary driver of this 'atmospheric moistening' is the increase in carbon dioxide caused by the burning of fossil fuels.
there has been a definite increase in rain data wouldnt you say? there has been a definite increase in atmospheric polution that blocks the sun comming from the chinese polution machine wouldnt you say? some companies believe that C02 is a Global Warming contributor CARBON STORAGE they want to cover up the C02 so that they can keep on using fosil fuels. I cant understand why people cant understand or dont include the most obvious things. But I can understand that if someone wants to put a point accross and he willingly leaves out things that would not benifit his point , he is just trying to impose his ideas for his benifit. .
Last edited by paul; 06/14/08 01:59 PM.
3/4 inch of dust build up on the moon in 4.527 billion years,LOL and QM is fantasy science.
|
|
|
|
|
Joined: Oct 2006
Posts: 1,164
Megastar
|
|
Megastar
Joined: Oct 2006
Posts: 1,164 |
Let's go back to the data.
....
Do you have any proof that Motl's formula is wrong? If I may defer comments on the data, paul's "weather observations," and Motl's formula (who? what?); and hope to stay on the topic of CO2's mechanism of heating, ...for one more round ...let me just say.... === Eggs Ackerly! That would be fine if you assume that the CO2 holds the heat for more than a few seconds. The atmosphere is most dense near the ground. Either the CO2 molecule would re-radiate the energy, or it would change its energy level via a collision with another molecule. contributing to atmospheric heating. Also, after re-radiating the IR away, it is absorbed by another CO2 quite rapidly, as you mention (and the extinction coeff. also shows). CO2, on average, is usually "excited" with IR heat. Think of the continual relaxation of CO2 (through re-radiation & collisions), and notice the [whatever] fraction of relaxation that results in those collisions. It is this fraction of energy, the collisions, that determine how much of that absorbed IR gets translated (via those collisions) into heating of the atmosphere. It is this heating that is proportional to CO2 concentration.Canuck's graph suggests that the collisions are frequent enough that none of the 4.3 or 15 micron wavelengths are able to escape to space; Exactly, as evidenced by the spectrum showing that very little is escaping into space anymore. therefore, the area under the curve is the IR that gets absorbed before it is converted to another wavelength. Exactly; and don't forget that via other collisions and/or the absorption of higher energy wavelengths, CO2 will spontaneously emit the lower energy IR (heat) wavelengths, before then, as you mention, they also eventually get "converted to another [usually longer] wavelength" (if not translated into atmospheric heating, via collisions). We shouldn't view this as just a snapshot of what happens to one IR quantum; but realize that there is a never-ending, relentlessly ongoing source of these quanta. It is the net average of all this flux in energy, converting it's wavelength "to what is easiest," that creates the (roughly bell-shaped) blackbody profile that we measure. Intuitively, if we're shrinking that window through which heat escapes, and retaining that heat here on Earth longer, doesn't it make sense that things would heat up? I think this is where the "greenhouse analogy" makes the most sense; and not as a proxy for the exact physical mechanism of GHG heating. How, where, and when Green-House Gas heating affects the climate is open to debate, but I think the physical mechanism of GHG heating is the same regardless of one's worldview or opinion of the "climate change" debate. Thanks,
Pyrolysis creates reduced carbon! ...Time for the next step in our evolutionary symbiosis with fire.
|
|
|
|
|
Joined: Aug 2006
Posts: 174
Senior Member
|
|
Senior Member
Joined: Aug 2006
Posts: 174 |
Paul You guys seem to be hung up on temperature data. Without the temperature going up, there is no heating and no positive feedback. The upper troposphere is not warming. The ground temperatures are not warming. The oceans have cooled slightly since 2005. There has been no atmospheric warming for 6 years, yet you are suggesting that there is somehow positive feedback? Even you admit that you need warming first! The types of clouds that result matter. Increasing the lower storm clouds increases the rain we get and our albedo. That will cool us much more than miniscule changes in a trace gas will ever warm us. Samwik The area under the graph is growing slowly for each doubling. The first 350 (or whatever concentration was current when that graph was calculated) has a large area. The next 350 barely increases the area; therefore, the relationship is logarithmic. I wonder what the chances are of a CO2 molecule radiating its heat to either a water, space, or another CO2 molecule before it runs into either an oxygen (20.9463%), argon (0.93422%), or nitrogen (78.0842%) molecule and loses some of its energy. Those make up 99.96472% of our atmosphere. Exactly, as evidenced by the spectrum showing that very little is escaping into space anymore. Anymore? Are you suggesting that this recently changed? I would love to see proof of that one! Considering the logarithmic relationship for CO2 and temperature, I currently don't see how that is possible. I used Motl's formula (that he describes as a popular one for CO2) in my 26570 comment above
|
|
|
|
|
Joined: Aug 2006
Posts: 174
Senior Member
|
|
Senior Member
Joined: Aug 2006
Posts: 174 |
Paul. Perhaps I was too hasty. While on my walk home for lunch, I thought about how clouds are formed. Most of the time, clouds are started with a biological cloud condensing nuclei. Seeing as how CO2 increases biological life on land and in the oceans, that could be part of the reason for the increased rain and cooling.
|
|
|
|
|
Joined: Oct 2006
Posts: 1,164
Megastar
|
|
Megastar
Joined: Oct 2006
Posts: 1,164 |
The area under the graph is growing slowly for each doubling.... therefore, the relationship is logarithmic. Yes, but this is a graph of absorption, not temperature. === About the, Originally Posted By: samwik
Exactly, as evidenced by the spectrum showing that very little is escaping into space anymore. Anymore? Are you suggesting that this recently changed?" ...asked from your last post: Think of the shape of the top of the (CO2 + water) peak that is cut off. It's a very ragged peak. Some of the valleys from that "ragged peak" are visible in your close-up of 15 microns (post #26570, "fig.3"). If this was lowered (lower concentration, i.e. 285 ppm), wouldn't there be some valleys (windows) opening wider, as the bottom of other valleys came into view? === ...but back to the mechanism of heating. That CO2 is effective at trapping IR heat quickly, over short distances (logarithmically, to extinction), only means that it is a better greenhouse gas than any gas that has a lower extinction coefficient. The extinction coefficient doesn't mean that 'it can't absorb any more heat' (which is what some blogger has interpreted), but refers to how quickly a gas absorbs energy (in this case, IR heat). If it were "heated to extinction" with heat, and couldn't absorb more heat, then we'd be seeing some heat escape into space at that wavelength; but the graph shows that's not happening (anymore). [next week: saturation....] John, you said "I used Motl's formula (that he describes as a popular one for CO2) in my 26570 comment above." [Here is a link to a physicist that discusses the relationship between CO2 and temperature as logathrimic.
Using his Temperature = Temperature0 + ln(1 + 1.2 x + 0.005 x2 + 0.0000014 x3) formula, I made the following spreadsheet: This link was to Gary Novak, notable as a climatologically inclined "mushroom scientist." Someone can't just take a formula for determining the Extinction Coefficient [Absorption = Absorption0 + ln(1 + 1.2 x + 0.005 x2 + 0.0000014 x3) ] and substitute "Temp." into the equation, in place of Absorption. That is all someone [Motl or whomever] has done here. There is no "logarithmic relationship for CO2 and temperature," except in the mind of some blogger, and those who have picked it up as a scientific-sounding fact. Considering the logarithmic relationship for CO2 and temperature, I currently don't see how that is possible I can see that you "currently" think this is a fact; but that is the very point we're debating here: Is the extinction coefficient (which has a well-established logarithmic relation to concentration), proportional to the temperature change? The only thing I learned from that Gary Novak link was that "Steve McIntyre at climateaudit.org is trying to locate the provenance ;-) of the logarithmic formula [relating Temp. & concentration]...." Gee, it oughta be in any chemical reference book, (Merck's CRC perhaps?) if it's not just a made up "formula." I can understand how someone could hear that the absorption of IR is logarithmic and think that must apply to the heating also, but it just refers to how quickly IR heat is absorbed (or over what distance) at a given concentration. But.... Absorption of IR quanta is a quantum process, and can be described by an equation containing 2nd, 3rd, 4th, etc.... order terms; leading to the logarithmic expression. There are some hints of what is involved in describing this process on the "climate surfings" link: http://209.85.173.104/search?q=cache:2vN5elQF66wJ:www.hthpweb.com/hthp/fulltext/h34/htwu309.pdf+%22extinction+coefficient%22+%22heat+capacity%22&hl=en&ct=clnk&cd=20&gl=us .... "The second and third terms characterise the increase of 'I' due to isotropic scattering and re-emission, respectively."
.... "A considerable fraction of photons can pass through the sample without being multiply scattered or absorbed, which causes a direct radiative exchange between the surfaces. Therefore, besides the conductive heat transfer, the radiative heat transfer and the interaction of both transfer channels have to be considered, too."
... "In the case of a cold sample the re-emission term in equation (3) vanishes and there is no interaction of radiation with other heat transfer modes. The part of the incoming radiation flux F which reaches the point t within the sample is described by an additional source term...." ...meanwhile.... Heating, via collisions, is a Newtonian process, and is described by simple linear equations; and so is directly proportional to concentration. . . . I wonder what the chances are of a CO2 molecule radiating its heat to either a water, space, or another CO2 molecule before it runs into either an oxygen (20.9463%), argon (0.93422%), or nitrogen (78.0842%) molecule and loses some of its energy. Probably fairly low. Most likely, excited CO2 will collide with O2 or N2 as it "loses some of its energy." You've just described the mechanism that is defined as heating of the atmosphere. & For the few heat quanta that are transferred to another CO2, or water, those also eventually are translated into heat, via collisions with the more abundant atmospheric gases, as you've suggested. Thanks again,
Pyrolysis creates reduced carbon! ...Time for the next step in our evolutionary symbiosis with fire.
|
|
|
|
|
Joined: Aug 2006
Posts: 174
Senior Member
|
|
Senior Member
Joined: Aug 2006
Posts: 174 |
2 thoughts:
If adding CO2 causes only a little more radiation to be absorbed because the relationship is logarithmic, then only a little more heating is possible.
If there is no more energy to be absorbed because none makes it to space anyway, then adding more CO2 will not increase the temperature.
|
|
|
|
|
Joined: Oct 2006
Posts: 1,164
Megastar
|
|
Megastar
Joined: Oct 2006
Posts: 1,164 |
...as to your first point.... [typed earlier] I'm thinking you'll now try to say that the fraction of heat lost thru collisions versus re-radiation is what is logarithmic; but.... reply to anticipated response: For this "logarithmic heating idea" to be valid, there would have to be mostly heating via collisions (and fewer re-radiations) at the lowest concentrations; and the fewest collisions (with mostly re-radiation) at the moderate to higher concentrations. . . Fewer collisions ...at the higher concentrations? Does that make sense? === I'll look at the second point now.... p.s. ...hmmmm. Maybe I didn't anticipate very well. I'll have to look at this again... sorry....
Last edited by samwik; 06/17/08 05:45 AM. Reason: add p.s.
Pyrolysis creates reduced carbon! ...Time for the next step in our evolutionary symbiosis with fire.
|
|
|
|
|
Joined: Oct 2006
Posts: 1,164
Megastar
|
|
Megastar
Joined: Oct 2006
Posts: 1,164 |
Ah yes, the second point. I knew we'd be getting into saturation sooner or later. The term "saturated" has come up, and becomes important now to understanding how extinction is tangentially related to temperature. The amount of "saturation" refers to how long a molecule will remain relaxed, not excited by a particular wavelength (or the other way around, I guess). So a fully saturated gas would be continually excited by incoming radiation; and a half saturated gas would spend half of it's time relaxed, before absorbing more incoming radiation. Saturation varies differently at different altitudes; but all we need to know is that the IR is 100% absorbed (mostly) before it gets lost to space. This means that saturation is not totally complete, otherwise the unabsorbable IR would escape to space. [I typed this hastily, earlier; but I think it's expressed correctly and also applies] The point being that as CO2 is relaxing, it absorbs more IR to become excited again. It's an equilibrium, depending on the amount of incoming radiation. [whoops, have to catch Jay Leno's "headlines:" hehe: the Pickle/Ryder wedding; and the Gentle/Bang wedding... Well, anyway, a certain portion of the CO2 is always losing it's energy via collisions, to the rest of the atmosphere... in proportion to it's concentration (and temperature). This logarithmic thing really is just a misunderstood juxtaposition of two measurable parameters (or scientific concepts). But as I said, the how, when, and where of "climate effects" are plenty open to debate. That cirrus clouds Topic was very interesting. I'm hoping to head over that way eventually.  ~Thanks again, ~SA
Last edited by samwik; 06/17/08 05:17 AM. Reason: haste
Pyrolysis creates reduced carbon! ...Time for the next step in our evolutionary symbiosis with fire.
|
|
|
|
|
Joined: Oct 2006
Posts: 1,164
Megastar
|
|
Megastar
Joined: Oct 2006
Posts: 1,164 |
#1. If adding CO2 causes only a little more radiation to be absorbed because the relationship is logarithmic, then only a little more heating is possible.
Let me try that #1 again: No. Again, you're equating absorption with heating; ...but to answer the suggestion: In the real world (and not a 1 cm cuvette), it'd just be absorbed farther away, where CO2 wasn't already excited (to extinction). Better? Later, ~
Pyrolysis creates reduced carbon! ...Time for the next step in our evolutionary symbiosis with fire.
|
|
|
|
|
Joined: Oct 2006
Posts: 1,164
Megastar
|
|
Megastar
Joined: Oct 2006
Posts: 1,164 |
Hiya John,
This is getting too complicated; I'm not sure what I wrote in those last three posts makes enough sense, or answers your points. I'm just going on what I learned in general, 25 years ago. I'm about at my limit, although our previous posts about the mechanism, quantum stuff and explanations of the spectra, etc., are pretty good, solid stuff ...IMHO.
The real point that has come out of all of this is that the "logarithmic formula" has no citable source. The only place to find it is on the denialist sites.
If you want to prove me wrong, you need to find some citable source for that formula, that isn't based on a blog or some denialist webstitution (but preferably based on a dot.edu site, or from a scientific journal or book).
What'ya think?
Later...
~Sam
p.s. Just recall all those P = T/V (pressure, temperature, volume) equations; they didn't depend logarithmically on the concentration, did they?
Last edited by samwik; 06/17/08 07:35 AM. Reason: add p.s.
Pyrolysis creates reduced carbon! ...Time for the next step in our evolutionary symbiosis with fire.
|
|
|
|
|


