http://www.scienceagogo.com/forum/ubbthreads.php?ubb=showflat&Number=25261#Post25261"These fluxes indicate that 30% of the heat gained by the ground in the last five centuries was deposited during the last fifty years, and over half of the five-century heat gain occurred during the 20th century."
This is a definite "Hockey Stick" isn't it?

I think you have to be very careful with this kind of misleading statement. When you consider the possibility of natural variation over the last 500 years (eg. LIA) .... the statement is complete nonsense ... whats the point of making a view on the "percentage gain from the last century" out of the last 500 years if you don't look at the whole story ...
G'day ImranCan,
Which statement is misleading. I am a little confused with Samwik's comments. The comment "a hockey stick" normally refers to the very much fudged data used by Al Gore in an incomplete truth that was derived by a group of scientists that simply discarded any studies that gave a different result to their ideal of a hockey stick. That type of scientific methodology should be unacceptable to anyone and should be roundly condemned. That it wasn't by a great many shows just how bad this debate can get.
Both your posts, to me anyway, are ambigious. You indicate that there is a misleading statement but don't say what statement that is that is misleading. The research or the comment by Samwik? Samwik uses a reference to "Hockey Stick" that could mean that the study would produce a very neat hockey stick and thus would reinforce other studies or it could be in a derogatory way saying that this study too seems to be too good to be true.
This isn't a critiscm of any stance by either of you, only a request to make the comments less ambigious so we actually know what we are meant to be discussing.
...Oh, and I really don't like references to studies that are available only to members of the organisation that controls the website.
....Richard
LOL, Richard. I hadn't thought of that interpretation; guess I'm not as cynical about Al's data (I thought it was just poorly "scaled").
Capitalizing the term probably made it sound like "the famous hockey stick," eh?
Thanks for asking for clarity on the comment; I too was wondering which was misleading or nonsense.
I think it's me that is misleading (and you were wondering!); and Beltrami, et al. that is "complete...."
Richard
I agree with your comments about the paper. But this paper just gives an example of a scenario where the global temperature has not been flat over the last centuries. We could equally well just call on anecdotal evidence from Europe regarding the LIA. My point was that in a scenario where global temperatures vary up and down (or down and up), a statement quoting 50 % of warming in the last 100 years from an overall period of 500 years might sound alarming but it doesn't mean much.
G'day Samwik and ImranCan,
Thanks for the clarifications. Makes more sense.
Actually to a lot of people, even with fluctuations, a substantial amount of warming occuring in a very compressed period (50% within a century, the other 50% over the previous 400 years) might still sound alarming. I'd like to see any data that suggests that there has been any overall warming over the period 1500 to 1900. That really doesn't match ANY data that I've seen, including all those that support global warming strongly. There was a bit of a warming in 1500 itself and certainly from 1870 or 1880 to 1900, and a fluctuation again in the late 1700's if I'm not mistaken but overall this period was a very cold period. I don't particularly like the term Little Ice Age because it is actually made up of three periods of cooling and all three might not have been world wide although two of the three appear to have been.
It may well be, just as 1880 seems always to be picked to show global warming, that picking 1500 or therabouts as a starting point does show a warming trend because you are cutting out one of the LIA components and some of the second, but overall I don't think anyone that has studied the various evidence that is available would say that the period wasn't basically colder than has been the norm this interglacial period. There is a great deal of argument about whether it was just a bit colder or very much colder but either way, where does this first 50% come from?
Another study that just looking at it briefly seems to demonstrate a failure to accord with basic evidence. I find the fact that these types of studies are published, peer reviewed, and not criticised extremely disheartening.
Regards, Richard
Okay, now that this is caught up....
Here's a link to a copy of the paper:http://climatesci.colorado.edu/publications/pdf/beltrami-etal2002.pdfCharts and graphs, equations, etc.
Oh, and I see I was mistaken when I said "Indonesia." It should have been Australia.
Just a quick note to say I pondered your points, but after more research, I think this still does stand up.
The lack of any signature from the LIA is to be expected with a 50 year averaged reading.
There is some raw data out there with yearly readings. I'll look for it and see if some of the solar minima show up.
Also, I think the limited warming shown for the "first 50%" is entirely consistent with the course of the LIA.
It had reached its minimum by about 1550-1600; and so, has been rising (in general) since that time.
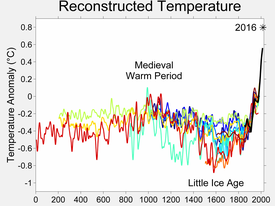
http://en.wikipedia.org/wiki/Image:2000_Year_Temperature_Comparison.png
from:
http://en.wikipedia.org/wiki/Little_Ice_AgeI'd say the average (from ~1500 on) of this picture matches Beltrami's "hockey stick."
Do you see what I mean?


